ASM Website
Paranal Astronomical Site Monitor (ASM)
The ESO Paranal Observatory’s ASM comprises a suite of instruments available for the continuous monitoring of meteorological and atmospheric conditions. The information is relevant to support:
- Safety of the operations: critical weather conditions.
- Engineering operations: specific atmospheric conditions are required for conducting some of the engineering work in open environment and at height, e.g., work on the telescope domes.
- Science operations: observing blocks are filtered and ranked depending upon wind conditions, seeing, coherence time of the atmospheric turbulence, ground layer fraction, and precipitable water vapor.
This page summarizes information on the following:
- Site coordinates.
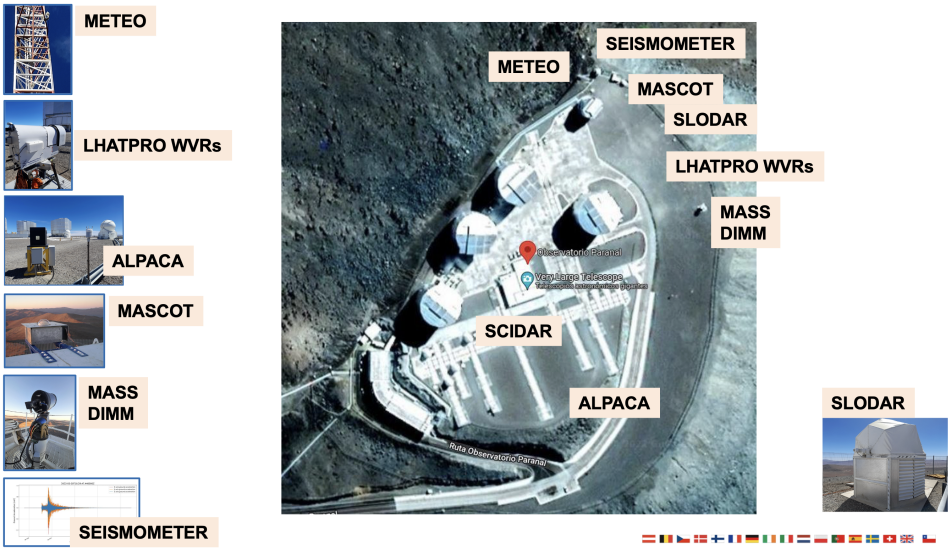
- Brief description of the ASM instruments. For more detailed information links to relevant papers are provided.
- Statistics of meteorological, seeing, and coherence time of turbulence.
- A brief description of the ASM database, with links to access specific data.
- Sky conditions.
The ASM instruments are installed at suitable locations in the perimeter of the ESO’s VLT platform.