Health Check monitor


Agora | CAL | HC | refs | QC
HealthCheck Monitor
    HOME | UsersGuide
FORS2:
lamps: imaging
Other HC:
QC links:
FORS2 trending system: HEALTH CHECK plot
Last update: 2008-11-20T05:11:26 (UT)
now: 2008-11-20T20:52:50 (UT)
scores active INFO USERS-GUIDE MORE
same group: SCR_FF_UV SCR_FF_B SCR_FF_RI
last OPSLOG data:
2008-11-18
Plot: 1 2 3 4   latest_files
N_data: number of recent OPSLOG entries plotted here
N_data: 1 1 1 1 availability
less ... | history ... | plot tutorial ... | contact               [?]
Print: Information and research: News:
- png file - advanced studies: QC1 browser | QC1 plotter
2008-03-20Lamp flux values from the new pipeline may differ from the old values.
Plot
?
Symb
?
Source
*
OPS?
**
Average ? Thresholds ? N_
data
QC1
parameter
Data
downloads
Remarks
method value unit method value
1 QC1DB yes (1) MEDIAN 9044.86523 ADU 5%± 452.24326 16 efficiency this | last_yr | all B_BESS, low gain (Garching)
2 QC1DB yes (1) MEDIAN 8730.32324 ADU 5%± 436.51617 16 efficiency this | last_yr | all B_BESS, low gain (Garching)
3 QC1DB yes (1) MEDIAN 15394.9209 ADU 5%± 769.74603 16 efficiency this | last_yr | all B_BESS, high gain (Garching)
4 QC1DB yes (1) MEDIAN 14817.74805 ADU 5%± 740.88739 16 efficiency this | last_yr | all B_BESS, high gain (Garching)
*Data sources: QC1DB: QC1 database; LOCAL: local text file | **OPS: to indicate that OPSLOG data are included
General information

Click on any of the plots to see a close-up version.

If applicable, the latest values from Paranal ops logs are plotted as blue dots. More information about those values, including a download option, is available in the OPSLOG section on top of the page.

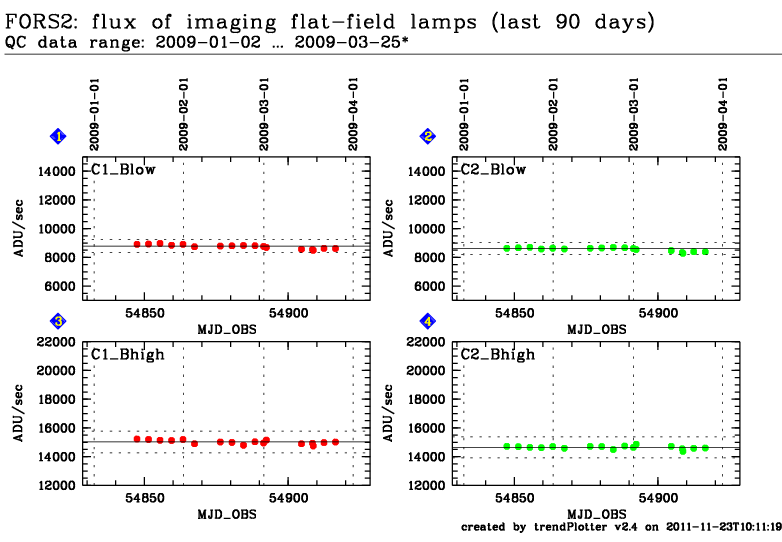
The latest date is indicated on top of the plot, data points belonging to that date are specially marked.

If configured,

  • statistical averages are indicated by a solid line, and thresholds by broken lines
  • outliers are marked by a red asterisk. They are defined as data points outside the threshold lines
  • "aliens" (= data points outside the plot Y limits) are marked by a red arrow ( or )
  • you can download the data for each parameter set if the 'Data downloads' link shows up