Plot
? |
Symb
? |
Source
* |
Average ? |
Thresholds ? |
N_
data |
QC1
parameter |
Data
downloads |
Remarks |
| method |
value |
unit |
method |
value |
| 1 |
• | QC1DB |
MEDIAN |
2.34e+03 |
ADU |
60% | ± 1.4e+03 |
23 |
sigma_master |
this |
last_yr |
all
|
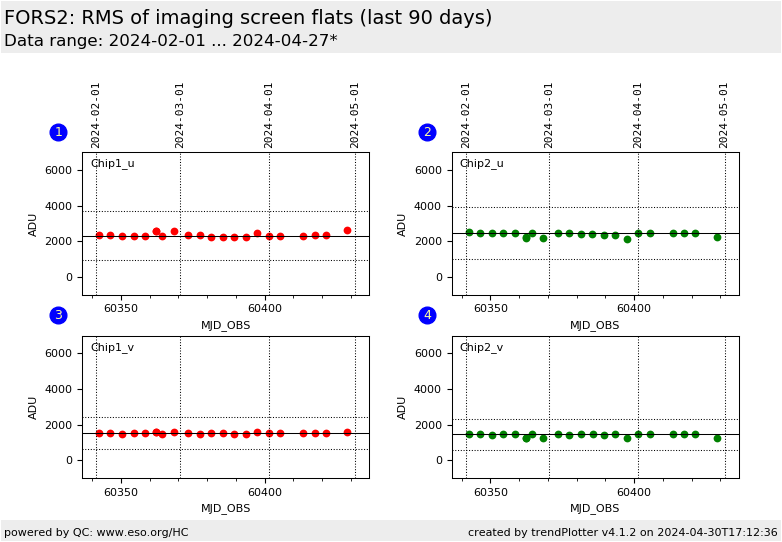
screen flat RMS in ADU for u_HIGH, chip 1 |
| 2 |
• | QC1DB |
MEDIAN |
2.43e+03 |
ADU |
60% | ± 1.46e+03 |
23 |
sigma_master |
this |
last_yr |
all
|
screen flat RMS in ADU for u_HIGH, chip 2 |
| 3 |
• | QC1DB |
MEDIAN |
1.55e+03 |
ADU |
60% | ± 932 |
23 |
sigma_master |
this |
last_yr |
all
|
screen flat RMS in ADU for v_HIGH, chip 1 |
| 4 |
• | QC1DB |
MEDIAN |
1.47e+03 |
ADU |
60% | ± 881 |
23 |
sigma_master |
this |
last_yr |
all
|
screen flat RMS in ADU for v_HIGH, chip 2 |
| |
|
*Data sources: QC1DB: QC1 database; LOCAL: local data source
|
Plot 1
scores:  2| 2|
| | data source: | fors2_scrflat
(QC1 database) |
| dataset: | sigma_master | • |
| median: | 2.34e+03 | ADU |
| rel. thresholds: ±60% | 935.296484...3741.185936 | ADU |
| N_data plotted: | 23 |
| [click plot for closeup] |
Plot 2
scores: 2|
| | data source: | fors2_scrflat
(QC1 database) |
| dataset: | sigma_master | • |
| median: | 2.43e+03 | ADU |
| rel. thresholds: ±60% | 971.463184...3885.852736 | ADU |
| N_data plotted: | 23 |
| [click plot for closeup] |
Plot 3
scores: 2|
| | data source: | fors2_scrflat
(QC1 database) |
| dataset: | sigma_master | • |
| median: | 1.55e+03 | ADU |
| rel. thresholds: ±60% | 621.6416...2486.5664 | ADU |
| N_data plotted: | 23 |
| [click plot for closeup] |
Plot 4
scores: 2|
| | data source: | fors2_scrflat
(QC1 database) |
| dataset: | sigma_master | • |
| median: | 1.47e+03 | ADU |
| rel. thresholds: ±60% | 587.172752...2348.691008 | ADU |
| N_data plotted: | 23 |
| [click plot for closeup] |
The FlatBlue+1 and FlatBlue+2 lamps are used for imaging screen flats.
The RMS is calculated from the master screen flat image pixel sample (2x2
binning) X: @200 @1800 and Y: @400 @800 covering the unvignetted area
of chip1 and chip2.
DB Name: fors2_scrflat
TPL.ID: FORS2_img_cal_scrflat
QC1 DB parameter: sigma_master
General information
Click on any of the plots to see a close-up version.
The latest date is indicated on top of the plot.
If configured,
- data points belonging to the latest date are specially marked
- statistical averages are indicated by a solid line, and thresholds by broken lines
- outliers are marked by a red asterisk. They are defined as data points outside the
threshold lines
- "aliens" (= data points outside the plot Y limits) are marked by a red arrow (↑ or ↓)
- you can download the data for each parameter set if the 'Data downloads' link shows up
|
