Quality Control and
Data Processing
GIRAFFE: Bias
2008-05-24: GIRAFFE CCD "Carreras" operational (often called "new") (replacing "Bruce"). Both CCDs are identical in format and size.
2011-01-11: fast read mode added 2016-04-01: the 'slow' mode is offered in VM, calibration data are processed and QC parameters are available, but they are not trended because of their very rare acquisition.
A set of 5 BIAS frames is measured daily as part of the routine calibration and health check plan. The BIAS level, the read noise and the structure are monitored. 'Normal' is the standard read mode of the CCD. The QC1 database has also some data for the 'Fast' and the 'Slow' mode, but (with the exception of the BIAS plot) there are no HC plots for these rarely used modes. Since October 2010, the fast readout mode is offered in addition to the normal readout mode. Its trending plots are set up the same way as the ones for normal read mode, find them under 'bias_Fast'. Other CCD parameters are monitored using the darks and the image flats.
 Read noise (raw and master)
The read noise (RON) is measured as rms in a single raw frame and in the master bias frame, using in both cases a small central window 100x100 pixels wide. The RON of the master bias frame is about a factor sqrt(N) lower than the raw file RON, where N typically is 5. RON is given in electrons, calculated from the ADU value using the nominal transformation factor (CONAD = 1/gain) 2.25 e-/ADU. (The measured CONAD values are close to that value, check out here.)
Algorithm Read noise (raw and master) The read noise (RON) is measured as rms in a single raw frame and in the master bias frame, using in both cases a small central window 100x100 pixels wide. Outliers below 100 and above 300 ADU are clipped.
Box 2 of the trending plot shows the RON of single raw BIAS frames, box 3 the RON of master bias frames.
Scoring&thresholds Read noise (raw and master) The sigma_raw is tightly scored, with dynamic thresholds following the median average of the current period. The thresholds could be made even tighter but due to the relatively small window for the noise measurement the risk of false red scores due to outlier cosmics would then increase. The window size is chosen as to minimize the larger-scale structure of the bias. The sigma_raw is a KPI parameter, with its reference value being 4.2 el- (from the commissioning report of the new CCD), slightly higher than the current value. The sigma_raw value is very stable over time.
BIAS level
Box 1 shows the median BIAS level measured across the whole CCD, given in ADU, for the 'Normal' read mode. It is calculated by the QC procedure (for historical reasons).
The median bias level is plotted in box 1 of the trending plot.
Normal read mode: Fast read mode: The mean bias has slowly decreased over the years. The median of the whole master_bias is calculated, values below 100 and above 300 ADU are clipped.
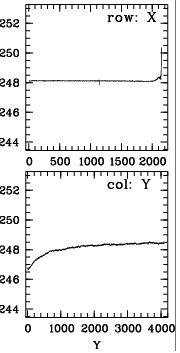
Structure
The GIRAFFE BIAS frames contain some structure which is monitored here.
Box 4 and 5 of the trending plot show the structure of the BIAS, derived from collapses of columns (structure in X direction, left) and rows (Y direction, right).
Both structure parameters are very stable with time. Both structure parameters are scored, with fixed thresholds set such as to be insensitive to normal fluctuations. A red score indicates a real issue with the detector. There are no reference values available. The master_bias is collapsed in X or Y direction, the rms of the result frame is measured.
Bad pixels
The number of bad pixels in GIRAFFE BIAS frames is monitored here. The pipeline delivers proper values only since 2008, for the new CCD.
Box 6 of the trending plot show the number of bad pixels which is usually between 0 and 200 in the new CCD. The pipeline delivered proper values only since 2008, for the new CCD. The number of bad pixels for the old CCD is much higher than currently, due to the bad columns. It would need to be corrected for those columns in order to gain significance. N_badpix is scored, with a loose upper threshold. If flagging red, there is a serious detector issue. There are no reference values available. Pipeline recipe.
|
|||||||||||||||||||||||||||||||||||||||||||||||||||||||||||||||||||||||||||||||||||||||||||||||||||||||||||||||||||||||||||||||||||||||||||||||||||||||||||||||||||||||||||||||||||||||||||||||||||||||||||||||||||||||||||||||||||||||||||||||||||||||||||||||||||||||||||||||||||||||||||||||||||||||||||||||||||||||||||||||||||||||||||||||||||||||||||||||||||||||||||||||||||||||||||||||||||||||||||||||||||||||||||||||||||||||||||||||||||||||||||||||||||||||||||||||||||||||||||||||||||||
| |
|||||||||||||||||||||||||||||||||||||||||||||||||||||||||||||||||||||||||||||||||||||||||||||||||||||||||||||||||||||||||||||||||||||||||||||||||||||||||||||||||||||||||||||||||||||||||||||||||||||||||||||||||||||||||||||||||||||||||||||||||||||||||||||||||||||||||||||||||||||||||||||||||||||||||||||||||||||||||||||||||||||||||||||||||||||||||||||||||||||||||||||||||||||||||||||||||||||||||||||||||||||||||||||||||||||||||||||||||||||||||||||||||||||||||||||||||||||||||||||||||||||
 |
|
||||||||||||||||||||||||||||||||||||||||||||||||||||||||||||||||||||||||||||||||||||||||||||||||||||||||||||||||||||||||||||||||||||||||||||||||||||||||||||||||||||||||||||||||||||||||||||||||||||||||||||||||||||||||||||||||||||||||||||||||||||||||||||||||||||||||||||||||||||||||||||||||||||||||||||||||||||||||||||||||||||||||||||||||||||||||||||||||||||||||||||||||||||||||||||||||||||||||||||||||||||||||||||||||||||||||||||||||||||||||||||||||||||||||||||||||||||||||||||||||||||