Quality Control and
Data Processing
|
SINFONI: Dark
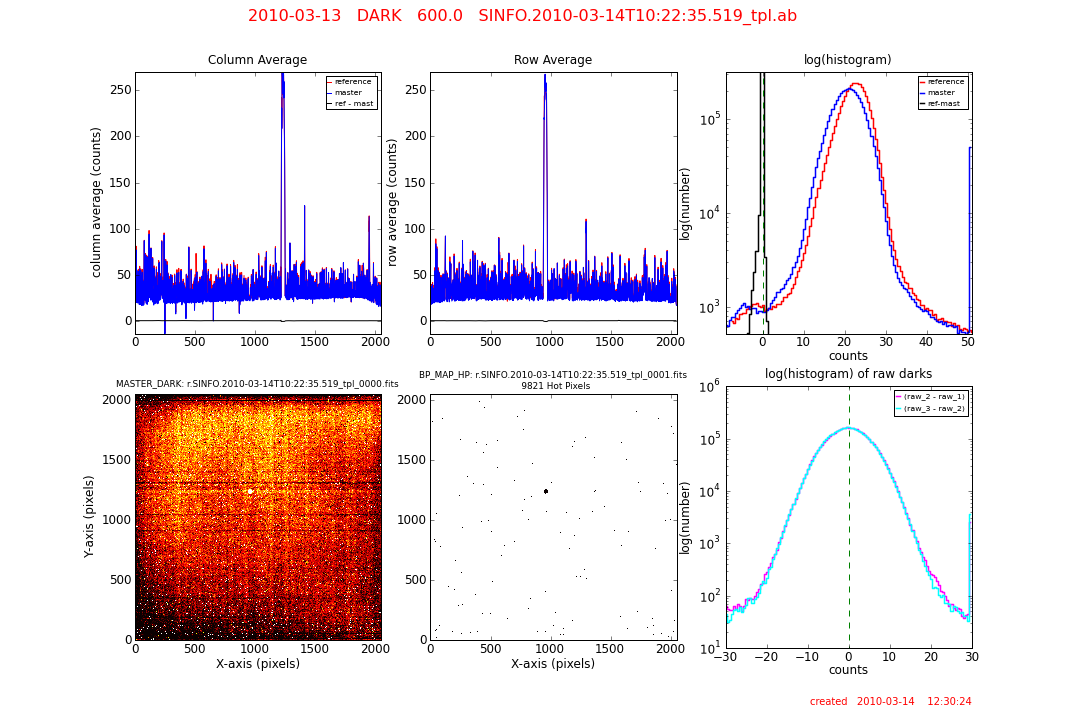
Dark frames are used to monitor the health and technical performance of the detector. For data processing they are used to correct the pixel-to-pixel dark current variations and to flag those pixels with very high dark currents (hot pixels). Dark frames are routinely obtained for each night that SINFONI is in operation. They come in stacks of 3 raw frames, and generally mirror the DIT's of the science observations. The SINFONI pipeline processes each group of 3 dark's into a master dark and a hot pixel map.
 Parameters trended
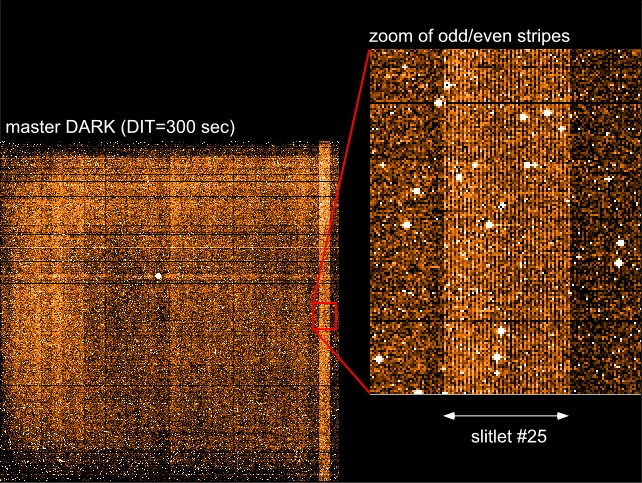
The QC report for the DARK includes: Scoring&thresholds Parameters trended Scoring thresholds have been set rather losely . SINFONI DARKs have been very stable over the current lifetime of the instrument. This can best be seen the the full history DARK trending plots shown here: FULL DARK history. SINFONI master dark as computed from 3 input raw frames (here DIT = 300 seconds). The circular feature of bad pixels near the center of the frame (made of up ~1000 pixels with elevated counts) is clearly visible and intrinsic to all SINFONI images. The median level is computed from all pixels in the master dark frame . The standard deviation is computed over all pixels in the master dark frame . The RON is computed over the entire detector and is monitored as a function of time and DIT. Two consecutive frames are subtracted from each other and the median standard deviation is determined from a number of sample areas and then normalized to DET.NDIT = 1. The RON is computed from the difference of the first two raw darks (qc_ron1) and the second pair of raw darks (qc_ron2). Since the very first dark of a series can sometimes have an elevated count level, qc_ron2 is used in the trending plots. The fixed pattern noise is computed by fitting a Gaussian to the histogram to the master dark. The FPN is simply the standard deviation (s) of this Gaussian fit. The FPN should scale linearly with the number of counts. The number of pixels having an intensity greater than a pipeline-defined threshold (default threshold is 10sigma). SINFONI frames sporadically show vertical stripes near slitlet #25 (see the images below). This potential feature is monitored by determining the median of all even columns (med(even)) and all odd columns (med(odd)) near slitlet #25 and then computing: oes25 = med(odd) - med(even) / 0.5 * (med(odd) + med(even)) The odd/even ratios are computed for each of the 3 raw dark frames (hence the values qc_oes1, 2, and 3). Read-out noise is calculated from the difference image of the 2nd - 1st raw frame (for ron1) or of the 3rd - 2nd raw frame (for ron2). It is the median of the standard deviations measured from 100 4x4 windows on the difference frame, multiplied by sqrt(NDIT/2). ~ ~ ~ ~
Issues
Sporadically, the SINFONI detector will show an electronic effect whereby vertical stripes are readily visible. This occurs near slitlet number 25 (near columns 1922 to 1985) with even numbered columns showing elevated counts (of a few ADU) above their neighbour odd numbered columns. This feature is relatively rare and is best seen in frames with longer (> 200 second) DIT's, but can be found in the dark, standard star, psf star, and science frames. It is only trended in the DARK frames using the odd/even column ratio. Clearly, frames not showing the odd/even vertical stripes have oes25 values near 0.0.
The SINFONI detector is afflicted by persistence if an overly bright source (generally having counts > 15 000 ADU) is observed. This effect decays with time, but if a DARK is obtained after observing such a bright source remnant flux will be visible.
Sometimes the source of persistence can be an over-exposed flat field image. In that case, the SINFONI master dark, instead of displaying residual source spectra, will show larger scale image residuals. For example, between March 20 and 25, 2011 an over-exposed flat produced the following effect on subsequent master darks:
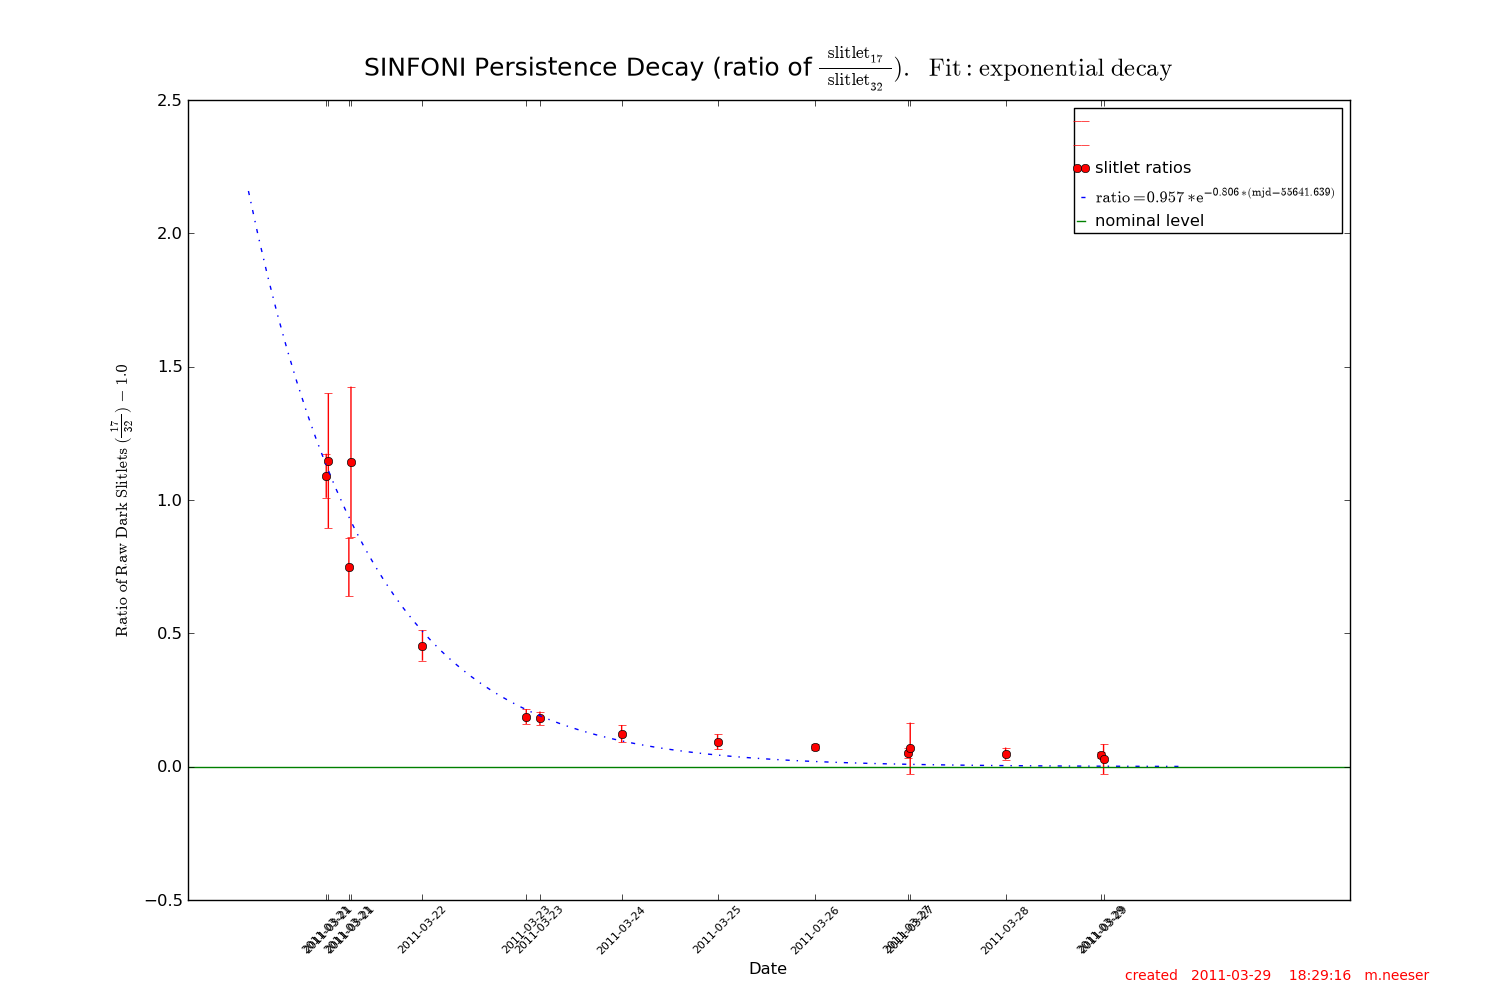
For seriously over-exposed data, the decay time until SINFONI DARKs return to their normal levels can take as long as several days. This persistence decay time can be seen in a plot of the flux ratio of slitlet17/slitlet32 as a function of time:
|
||||||||||||||||||||||||||||||||||||||||||||||||||||||||||||||||||||||||||||||||||||||||||||||||||||||||||||||||||||||||||||||||||||||||||||||||||||||||||||||||||||||||||||||||||||||||||||||||||||||||||||||||||||||||||||||||||||||||||||||||||||||||||||||||||||||||||||||||||||||||||||||||||||||||||||||||||||||||||||||||||||||||||||||||||||||||||||||||||
| |
|||||||||||||||||||||||||||||||||||||||||||||||||||||||||||||||||||||||||||||||||||||||||||||||||||||||||||||||||||||||||||||||||||||||||||||||||||||||||||||||||||||||||||||||||||||||||||||||||||||||||||||||||||||||||||||||||||||||||||||||||||||||||||||||||||||||||||||||||||||||||||||||||||||||||||||||||||||||||||||||||||||||||||||||||||||||||||||||||||
 |
|
||||||||||||||||||||||||||||||||||||||||||||||||||||||||||||||||||||||||||||||||||||||||||||||||||||||||||||||||||||||||||||||||||||||||||||||||||||||||||||||||||||||||||||||||||||||||||||||||||||||||||||||||||||||||||||||||||||||||||||||||||||||||||||||||||||||||||||||||||||||||||||||||||||||||||||||||||||||||||||||||||||||||||||||||||||||||||||||||||