Linearity frames are obtained in order to monitor the pixel-by-pixel response
properties of the detector as a function of flux intensity and to determine
when the detector becomes non-linear. The linearity calibration is made about
once per week in each of the four gratings and consist of a series of flat
lamp pairs (lamp-on and lamp-off) of increasing exposure lengths with DIT's
from 1 to 45 seconds. Pipeline distortion products included the BP_COEFF cube
which contains the non-linear fit coefficients for each pixel, the
LIN_DET_INFO table (containing the coefficients of the non-linear fit), the
GAIN_INFO table (containing the detector gain values), and BP_MAP_NL (the
non-linear bad pixel map image). All products are quality controlled and
trended.
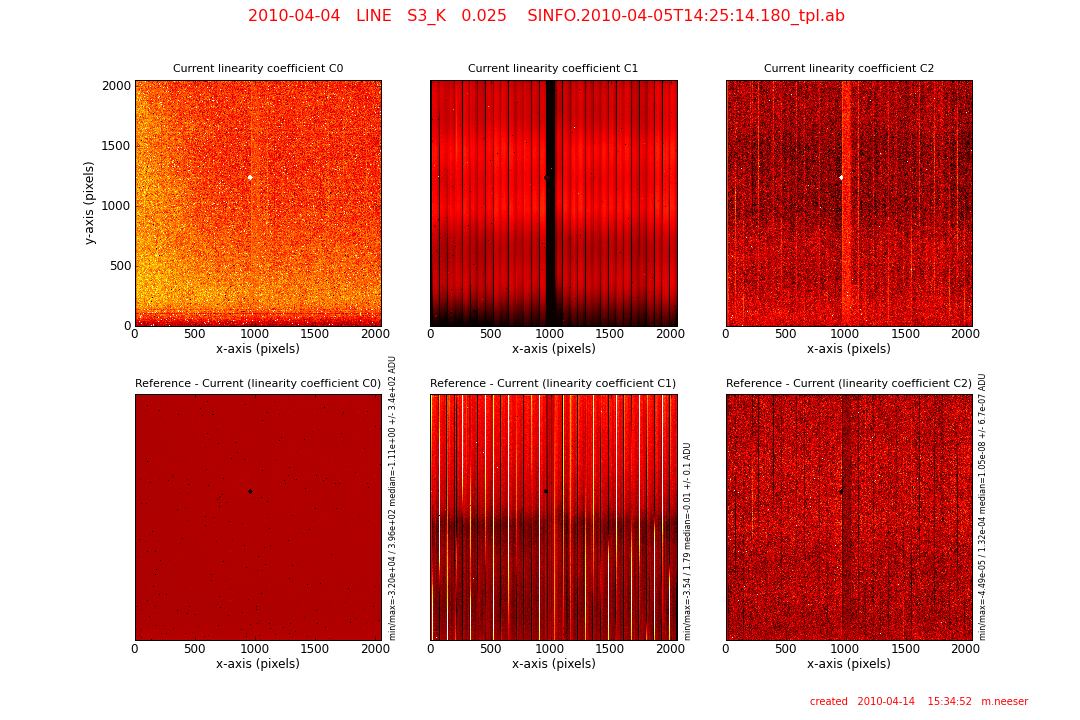
The three planes of the SINFONI non-linear polynomial coefficients cube (BP_COEFF). From left to right are the offset CO (dark), the linear part C1 (flat), and the quadratic term C2.
BP_COEFF is a 2048 x 2048 x 3 pixel cube in which each of the three planes is a non-linear polynomial coefficient per pixel.
UL: the current linearitycoefficient image LIN0 (BP_COEFF plane 1). The LIN0 coefficient is essentially a DARK.
UC: the current linearitycoefficient image LIN1 (BP_COEFF plane 2). The LIN1 coefficient is essentially a FLAT.
UR: the current linearitycoefficient image LIN2 (BP_COEFF plane 3). The LIN1 coefficient maps the non-linearity pixels.
LL: the difference between the reference and the current coefficient LIN0 images. The statistics of the difference image (minimum, maximum, median, and standard deviation) are listed to the right of the image.
LC: the difference between the reference and the current coefficient LIN1 images. The statistics of the difference image are listed to the right of the image.
LR: the difference between the reference and the current coefficient LIN2 images. The statistics of the difference image are listed to the right of the image.
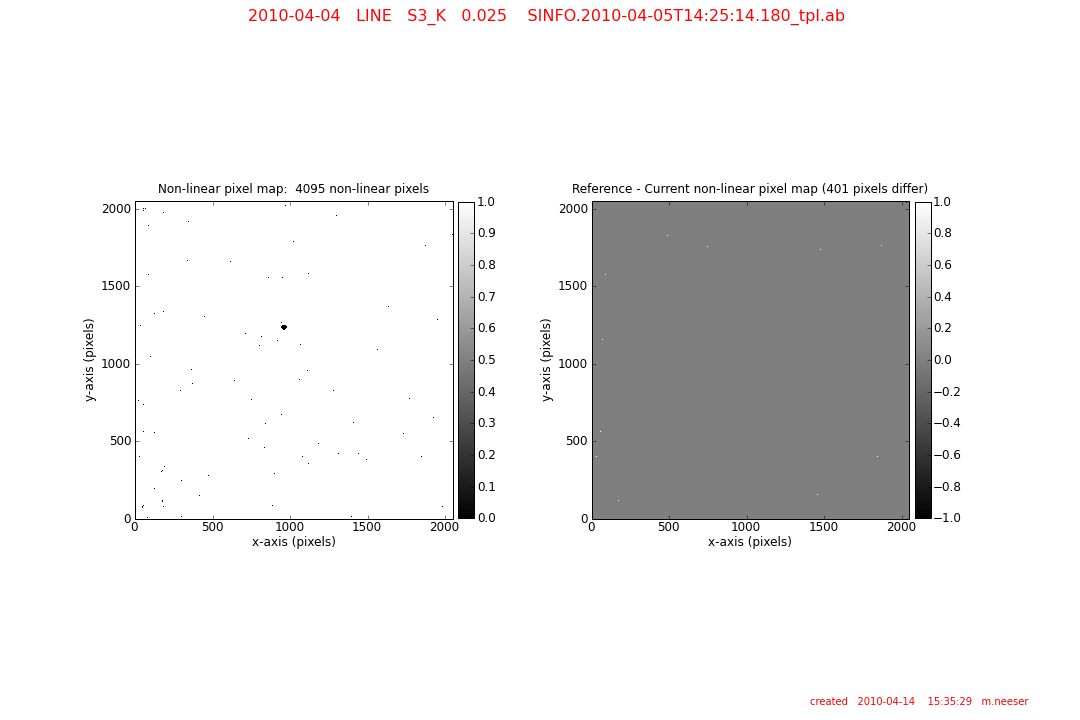
QC Report 2 (images):
left: a map of the non-linear pixels. Normal pixels are set to 1, while 0 denotes non-linear pixels.
right: the difference between the reference and current non-linear pixel maps.
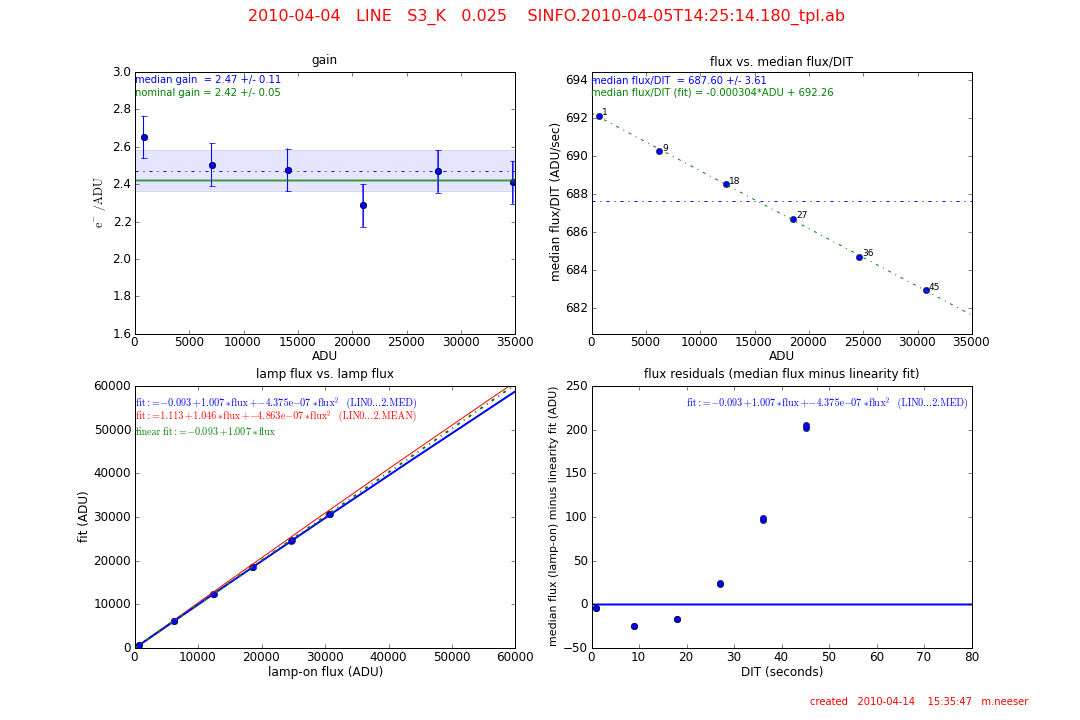
QC report 3
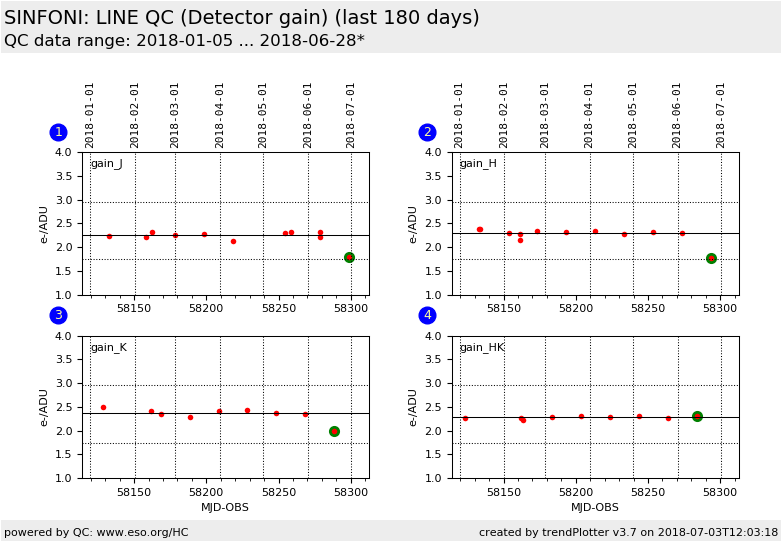
QC Report 3 (gain and linearity plots):
UL: the gain (e-/ADU) as a function of the linearity lamp flux level (ADU). The nominal gain (as per the SINFONI User's Manual pg. 44) is shown as a green line.
The median gain and its standard deviation is shown as a dotted blue line and a shaded blue area, respectively.
UR: the median flux per DIT (ADU/sec) is shown as a function of linearity lamp flux level (ADU). Each point is labelled with its DIT value. The median flux/DIT is shown as a dotted blue line.
A linear fit to this relation is shown as a green dotted line.
LL: the lamp-on flux vs. the linearity fit. The fit using median linearity value terms (LIN0.MED, LIN1.MED, and LIN2.MED) is shown as a blue line. The fit using the mean linearity value terms
( LIN0.MEAN, LIN1.MEAN, and LIN2.MEAN) is shown as a red line. A linear fit using the median values is plotted using a dotted green line.
LR: the fit residuals as a function of DIT (seconds). The full linearity fit (with the median coefficients) is subtracted from the median lamp-on flux.
These four panels show the gain (e-/ADU) for each of the four gratings (J, H, K, and H+K). Linearities are always made at the 25 mas pixel scale.
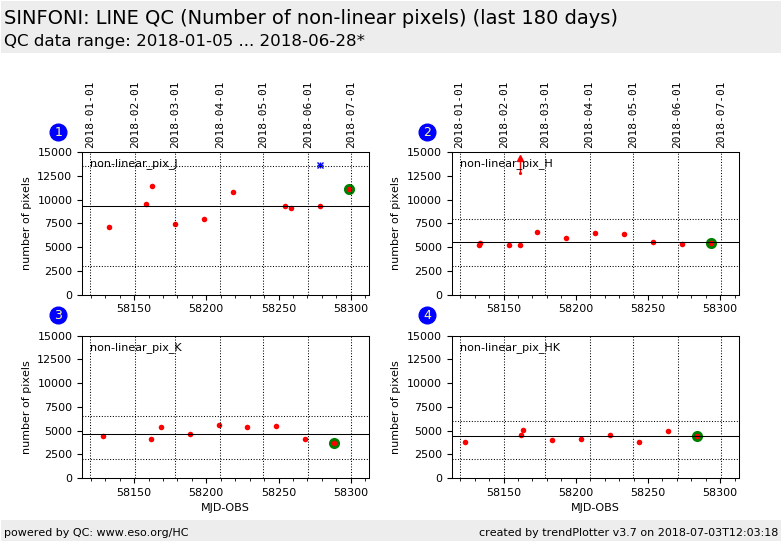
These four panels show the total number of non-linear pixels found for each of the four gratings (J, H, K, and H+K). Non-linear pixels generally are less than 0.2%.
The stability of SINFONI can be seen in the full history trending plots shown here: FULL Linearity history.
The overall lamp intensity of the flat used to make the linearities has sometimes been set too high (> 40, 000 counts), with the result that an excessive number of pixels enter the non-linear range. This can become apparent in large jump in the number of non-linear pixels detected (see above figure), the number of bad pixels visible in the master bad pixel map, and even in stacked wavelength lamp (seen as areas masked pixels), hence affecting the wavelength calibration solution.
A master bad pixel map showing an excessive number of non-linear pixels.
A stacked arc lamp image with a large number of masked pixels evident.
Users dealing with this over-exposed lamp flats can circumvent this problem by either removing the raw frames with the highest value DIT's from the linearity pipeline processing or, even more effectively, by increasing the pipeline parameter bp_lin-thresh_sigma_fct from its default (10) to 15.
Pairs of consecutive lamp-on flats (F1on and F2on) and lamp-off flats (F1off and F2off) are selected from the input data frames and their differences are computed: diffon = F1on - F2on and diffoff = F1off - F2off. The mean of each frame (F1on, F1off, . . . ) and the standard deviation of the differences (s(diffon) and s(diffoff)) are computed. The gain is then given by:
For each pixel a median flux level as a function of DIT is known and is compared to a linear fit (as given below to the coefficients C0 and C1). Those pixels that diverge from the linear fit by a given threshold are flagged as non-linear. The non-linear bad pixel map (BAD_MAP_NL) is combined with the hot and cold pixel maps to create a master bad pixel map (MASTER_BP_MAP).~
Each DIT in a linearity series is made up of four frames (two lamp-on and two lamp-off frames). The median of each image is computed and the lamp-on and lamp-off frames are subtracted:
The mean of all N med_diti is computed as:
Finally, a parabolic fit of the product of (DITi * mean), as a function of med_diti, is made with the coefficients C0, C1, and C2.
 Parameters trended