Plot
? |
Symb
? |
Source
* |
Average ? |
Thresholds ? |
N_
data |
QC1
parameter |
Data
downloads |
Remarks |
| method |
value |
unit |
method |
value |
| 1 |
• | QC1DB |
none |
|
NONE |
none | |
197 |
flux_1 |
this |
last_yr |
all
|
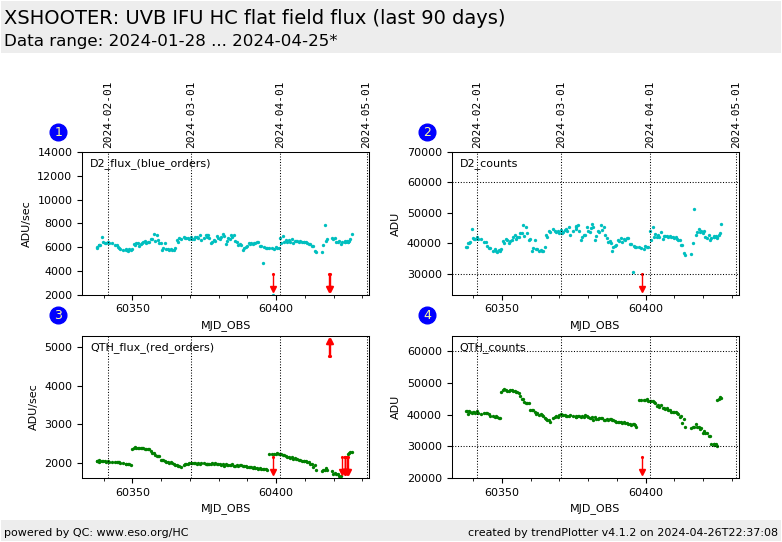
maximum lamp flux in D2 flat for IFU vs. time (100k/hg, 1x1) |
| 2 |
• | QC1DB |
none |
|
NONE |
VAL | 30000,60000 |
197 |
counts_1 |
this |
last_yr |
all
|
maximum flat counts in D2 flat for IFU vs. time (100k/hg, 1x1) |
| 3 |
• | QC1DB |
none |
|
NONE |
none | |
197 |
flux_2 |
this |
last_yr |
all
|
maximum lamp flux in QTH flat for IFU vs. time (100k/hg, 1x1) |
| 4 |
• | QC1DB |
none |
|
NONE |
VAL | 30000,60000 |
197 |
counts_2 |
this |
last_yr |
all
|
maximum flat counts in QTH flat for IFU vs. time (100k/hg, 1x1) |
| |
|
*Data sources: QC1DB: QC1 database; LOCAL: local data source
|
Plot 1
scores: not implemented
| | data source: | xshooter_flat
(QC1 database) |
| dataset: | flux_1 | • |
| average: | none |
| thresholds: | none |
| N_data plotted: | 197 |
| [click plot for closeup] |
Plot 2
scores:  15| 15|

| | data source: | xshooter_flat
(QC1 database) |
| dataset: | counts_1 | • |
| average: | none |
| fixed thresholds: | 30000...60000 | NONE |
| N_data plotted: | 197 |
| [click plot for closeup] |
Plot 3
scores: not implemented
| | data source: | xshooter_flat
(QC1 database) |
| dataset: | flux_2 | • |
| average: | none |
| thresholds: | none |
| N_data plotted: | 197 |
| [click plot for closeup] |
Plot 4
scores: 15|
| | data source: | xshooter_flat
(QC1 database) |
| dataset: | counts_2 | • |
| average: | none |
| fixed thresholds: | 30000...60000 | NONE |
| N_data plotted: | 197 |
| [click plot for closeup] |
Here we monitor the lamp flux in ADU/sec and the flat counts in ADU of the
daily acquired health check IFU flat
with setup 100k/1pt/hg. These HC IFU flats are composed of
two raw frames only, one with the D2 lamp and one with the QTH lamp.
The template is usually started twice a day, once at instrument startup and
once at the end of the day-time calibrations
The lamp flux is scored, the flat counts not.
There are
- deuterium halogen lamp flats (D2, used for lambda < 350 nm) operated with 4.667 sec exposure time and
- quartz lamp flats (QTH, used for lambda > 350 nm) operated with 12.333 sec exposure time .
Decrease in the D2/QTH flux might indicate problem with the UVB ADC.
For more information see the plot
tutorial page.
General information
Click on any of the plots to see a close-up version.
The latest date is indicated on top of the plot.
If configured,
- data points belonging to the latest date are specially marked
- statistical averages are indicated by a solid line, and thresholds by broken lines
- outliers are marked by a red asterisk. They are defined as data points outside the
threshold lines
- "aliens" (= data points outside the plot Y limits) are marked by a red arrow (↑ or ↓)
- you can download the data for each parameter set if the 'Data downloads' link shows up
|
