Plot
? |
Symb
? |
Source
* |
Average ? |
Thresholds ? |
N_
data |
QC1
parameter |
Data
downloads |
Remarks |
| method |
value |
unit |
method |
value |
| 1 |
• | QC1DB |
none |
|
ADU/sec |
VAL | 7500,15000 |
10 |
flux_1 |
this |
last_yr |
all
|
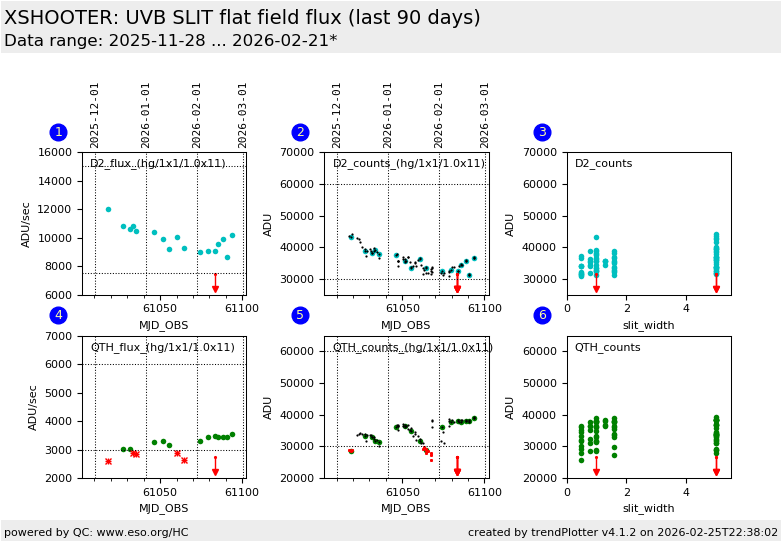
lamp flux [ADU/s] in D2 flat for 1.0x11 slit vs. time (100k/hg, 1x1) |
| 2 |
• | QC1DB |
none |
|
ADU |
none | |
10 |
counts_1 |
this |
last_yr |
all
|
maximum counts [ADU] in D2 flat for 1.0x11 slit vs. time (100k/hg, 1x1) |
| 2 |
• | QC1DB |
none |
|
ADU |
VAL | 30000,60000 |
74 |
counts_1 |
this |
last_yr |
all
|
maximum counts [ADU] in D2 flat for any slit slit vs. time (100k/hg, 1x1) |
| 3 |
• | QC1DB |
none |
|
ADU |
none | |
74 |
counts_1 |
this |
last_yr |
all
|
maximum counts [ADU] in D2 flat vs. slit width (100k/hg, 1x1) |
| 4 |
• | QC1DB |
none |
|
ADU/sec |
VAL | 3000,6000 |
10 |
flux_2 |
this |
last_yr |
all
|
lamp flux [ADU/s] in QTH flat for 1.0x11 slit vs. time (100k/hg, 1x1) |
| 5 |
• | QC1DB |
none |
|
ADU |
none | |
10 |
counts_2 |
this |
last_yr |
all
|
maximum counts [ADU] in QTH flat for 1.0x11 slit vs. time (100k/hg, 1x1) |
| 5 |
• | QC1DB |
none |
|
ADU |
VAL | 30000,60000 |
74 |
counts_2 |
this |
last_yr |
all
|
maximum counts [ADU] in QTH flat for any slit vs. time (100k/hg, 1x1) |
| 6 |
• | QC1DB |
none |
|
ADU |
none | |
74 |
counts_2 |
this |
last_yr |
all
|
maximum counts [ADU] in QTH flat vs. slit width (100k/hg, 1x1) |
| |
|
*Data sources: QC1DB: QC1 database; LOCAL: local data source
|
Plot 1
scores: not implemented
| | data source: | xshooter_flat
(QC1 database) |
| dataset: | flux_1 | • |
| average: | none |
| fixed thresholds: | 7500...15000 | ADU/sec |
| N_data plotted: | 10 |
| [click plot for closeup] |
Plot 2
scores:  4| 4|
| | data source: | xshooter_flat
(QC1 database) |
dataset:
(numbers below apply to this dataset) | counts_1 | • |
| average: | none |
| thresholds: | none |
| N_data plotted: | 10 |
| [click plot for closeup] |
Plot 3
scores: not implemented
| | data source: | xshooter_flat
(QC1 database) |
| dataset: | counts_1 | • |
| average: | none |
| thresholds: | none |
| N_data plotted: | 74 |
| [click plot for closeup] |
Plot 4
scores: not implemented
| | data source: | xshooter_flat
(QC1 database) |
| dataset: | flux_2 | • |
| average: | none |
| fixed thresholds: | 3000...6000 | ADU/sec |
| N_data plotted: | 10 |
| [click plot for closeup] |
Plot 5
scores: 4|
| | data source: | xshooter_flat
(QC1 database) |
dataset:
(numbers below apply to this dataset) | counts_2 | • |
| average: | none |
| thresholds: | none |
| N_data plotted: | 10 |
| [click plot for closeup] |
Plot 6
scores: not implemented
| | data source: | xshooter_flat
(QC1 database) |
| dataset: | counts_2 | • |
| average: | none |
| thresholds: | none |
| N_data plotted: | 74 |
| [click plot for closeup] |
setup used for monitoring is: 100k/1pt/hg read mode, 1.0x11 slit and 1x1 binning
D2 lamp is monitored via flux1 QC parameters
QTH lamp is monitored via flux2 QC parameters
Arguments for upper threshold of 60000 ADU:
- The flat field lamp fluctuations within a set of five raw frames can be +- 1000 ADU.
- When the counts QC parameter reaches 63000 ADU the first hot pixel begin to saturate.
- The UVB-arm detector is linear ( < 0.01) up to the saturation level of 65535 ADU.
General information
Click on any of the plots to see a close-up version.
The latest date is indicated on top of the plot.
If configured,
- data points belonging to the latest date are specially marked
- statistical averages are indicated by a solid line, and thresholds by broken lines
- outliers are marked by a red asterisk. They are defined as data points outside the
threshold lines
- "aliens" (= data points outside the plot Y limits) are marked by a red arrow (↑ or ↓)
- you can download the data for each parameter set if the 'Data downloads' link shows up
|
