Plot
? |
Symb
? |
Source
* |
Average ? |
Thresholds ? |
N_
data |
QC1
parameter |
Data
downloads |
Remarks |
| method |
value |
unit |
method |
value |
| 1 |
• | QC1DB |
none |
|
NONE |
VAL | 5000,12000 |
0 |
flux_1 |
this |
last_yr |
all
|
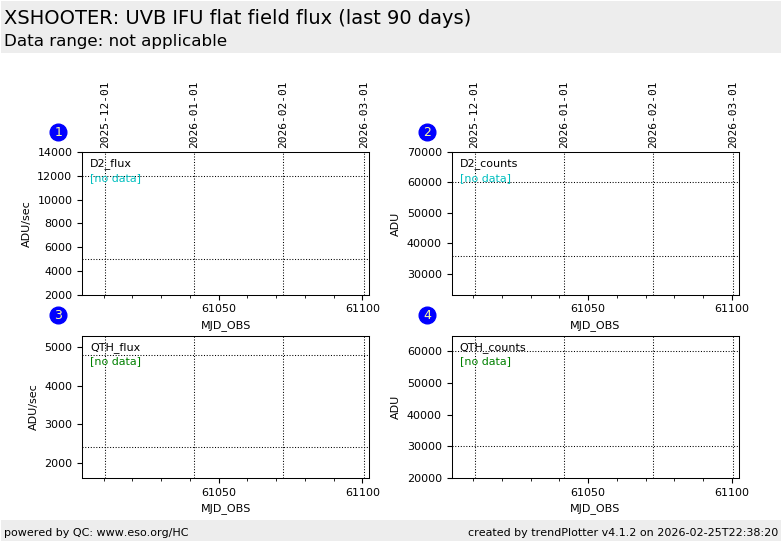
maximum flux in D2 flat for IFU vs. time (100k/hg, 1x1) |
| 2 |
• | QC1DB |
none |
|
NONE |
VAL | 35900,60000 |
0 |
counts_1 |
this |
last_yr |
all
|
maximum counts in D2 flat for IFU vs. time (100k/hg, 1x1) |
| 3 |
• | QC1DB |
none |
|
NONE |
VAL | 2400,4800 |
0 |
flux_2 |
this |
last_yr |
all
|
maximum flux in QTH flat for IFU vs. time (100k/hg, 1x1) |
| 4 |
• | QC1DB |
none |
|
NONE |
VAL | 30000,60000 |
0 |
counts_2 |
this |
last_yr |
all
|
maximum counts in QTH flat for IFU vs. time (100k/hg, 1x1) |
| |
|
*Data sources: QC1DB: QC1 database; LOCAL: local data source
|
Plot 1
scores: not implemented
| | data source: | xshooter_flat
(QC1 database) |
| dataset: | flux_1 | • |
| average: | none |
| fixed thresholds: | 5000...12000 | NONE |
| N_data plotted: | 0 |
| [click plot for closeup] |
Plot 2
scores:  2| 2|
| | data source: | xshooter_flat
(QC1 database) |
| dataset: | counts_1 | • |
| average: | none |
| fixed thresholds: | 35900...60000 | NONE |
| N_data plotted: | 0 |
| [click plot for closeup] |
Plot 3
scores: not implemented
| | data source: | xshooter_flat
(QC1 database) |
| dataset: | flux_2 | • |
| average: | none |
| fixed thresholds: | 2400...4800 | NONE |
| N_data plotted: | 0 |
| [click plot for closeup] |
Plot 4
scores: 2|
| | data source: | xshooter_flat
(QC1 database) |
| dataset: | counts_2 | • |
| average: | none |
| fixed thresholds: | 30000...60000 | NONE |
| N_data plotted: | 0 |
| [click plot for closeup] |
Here we monitor the lamp flux in ADU/sec and the flat counts ADU of
the IFU flat fields acquired with 100k/1pt/hg detector setup. The
flats are taken to calibrate science date. Each master flat
is composed of five frames illuminated by the D2 lamp and
five frames illuminated by the QTH lamp.
There are
- deuterium halogen lamp flats (D2, used for lambda < 350 nm) operated with 4.667 sec exposure time and
- quartz lamp flats (QTH, used for lambda > 350 nm) operated with 12.333 sec exposure time .
Decrease in the D2/QTH flux might indicate problem with the UVB ADC.
For more information see the plot
tutorial page.
General information
Click on any of the plots to see a close-up version.
The latest date is indicated on top of the plot.
If configured,
- data points belonging to the latest date are specially marked
- statistical averages are indicated by a solid line, and thresholds by broken lines
- outliers are marked by a red asterisk. They are defined as data points outside the
threshold lines
- "aliens" (= data points outside the plot Y limits) are marked by a red arrow (↑ or ↓)
- you can download the data for each parameter set if the 'Data downloads' link shows up
|
