Plot
? |
Symb
? |
Source
* |
Average ? |
Thresholds ? |
N_
data |
QC1
parameter |
Data
downloads |
Remarks |
| method |
value |
unit |
method |
value |
| 1 |
• | QC1DB |
MEDIAN |
0.00178 |
ADU |
VAL | -0.001,0.005 |
275 |
raw_med_std |
this |
last_yr |
all
|
The standard deviation over a sample of five raw frame median counts. This QC parameter is sensitive to fluctuations in the illumination level. |
| 2 |
• | QC1DB |
MEDIAN |
0.00441 |
ADU |
none | |
275 |
raw_mean_std |
this |
last_yr |
all
|
The standard deviation over a sample of five raw frame mean counts. This QC parameter is sensitive to fluctuations in the illumination level. |
| 3 |
• | QC1DB |
MEDAIN |
|
ADU |
none | |
275 |
raw_max_std |
this |
last_yr |
all
|
The standard deviation over a sample of five raw frame maximum counts. This QC parameter is sensitive to fluctuations in the illumination level and/or to fluctuations of the jnumber of bad pixel. |
| 4 |
• | QC1DB |
MEDIAN |
4.77e+04 |
ADU |
none | |
275 |
raw_max_avg |
this |
last_yr |
all
|
The maximum over a sample of five raw frame maximum counts. This QC parameter is sensitive if only frame of the sample saturates or has more counts. |
| |
|
*Data sources: QC1DB: QC1 database; LOCAL: local data source
|
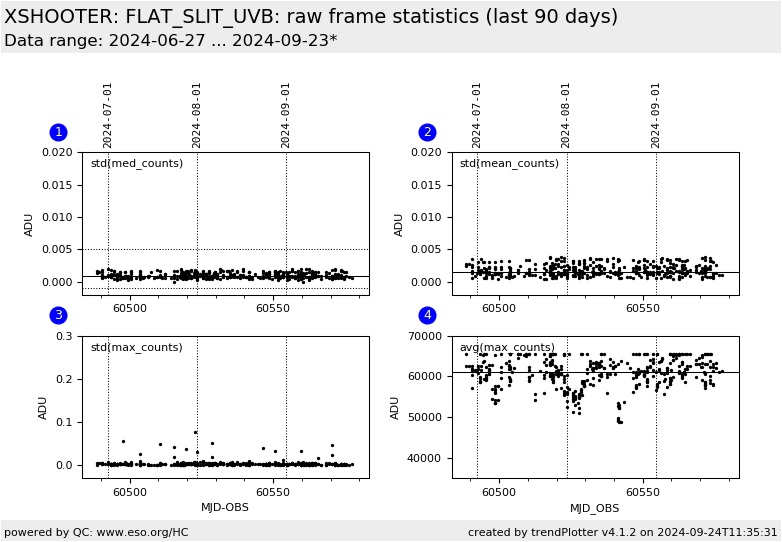
Plot 1
scores: not implemented
| | data source: | xshooter_flat
(QC1 database) |
| dataset: | raw_med_std | • |
| median: | 0.00178 | ADU |
| fixed thresholds: | -0.001...0.005 | ADU |
| N_data plotted: | 275 |
| [click plot for closeup] |
Plot 2
scores: not implemented
| | data source: | xshooter_flat
(QC1 database) |
| dataset: | raw_mean_std | • |
| median: | 0.00441 | ADU |
| thresholds: | none | |
| N_data plotted: | 275 |
| [click plot for closeup] |
Plot 3
scores: not implemented
| | data source: | xshooter_flat
(QC1 database) |
| dataset: | raw_max_std | • |
| median: | 0.00441 | ADU |
| thresholds: | none | |
| N_data plotted: | 275 |
| [click plot for closeup] |
Plot 4
scores: not implemented
| | data source: | xshooter_flat
(QC1 database) |
| dataset: | raw_max_avg | • |
| median: | 4.77e+04 | ADU |
| thresholds: | none | |
| N_data plotted: | 275 |
| [click plot for closeup] |
Since 2018-03, VIS-arm flat frames are subject of fluctuations of the
illumination level within the sequence of five raw frames. One ore
more raw frames can show brighter flats than the remaing raw flats of the sequence.
Brighter instances of raw flats can be partially saturated.
The most sensitive QC parameter is the standard deviation of the raw
frame median counts (here plot (1) ).
General information
Click on any of the plots to see a close-up version.
The latest date is indicated on top of the plot.
If configured,
- data points belonging to the latest date are specially marked
- statistical averages are indicated by a solid line, and thresholds by broken lines
- outliers are marked by a red asterisk. They are defined as data points outside the
threshold lines
- "aliens" (= data points outside the plot Y limits) are marked by a red arrow (↑ or ↓)
- you can download the data for each parameter set if the 'Data downloads' link shows up
|
