Plot
? |
Symb
? |
Source
* |
Average ? |
Thresholds ? |
N_
data |
QC1
parameter |
Data
downloads |
Remarks |
| method |
value |
unit |
method |
value |
| 1 |
• | QC1DB |
MEDIAN |
0.00792 |
ADU |
VAL | 0.005,0.015 |
243 |
slit_rms |
this |
last_yr |
all
|
rms of the slit function, any slit, only 1x1 binning |
| 2 |
• | QC1DB |
MEDIAN |
-0.000269 |
ADU/pix |
VAL | -0.0006,0.0005 |
243 |
slit_b |
this |
last_yr |
all
|
illumination gradient of the slit function, any slit, 1x1 binning only |
| 3 |
• | QC1DB |
none |
|
ADU/pix |
none | |
243 |
slit_db |
this |
last_yr |
all
|
error in slit illumination gradient b, any slit, 1x1 binning only |
| 4 |
• | QC1DB |
MEDIAN |
0.00424 |
ADU |
VAL | 0.002,0.007 |
181 |
slit_rms |
this |
last_yr |
all
|
rms of the slit function in IFU mode, 1x1 binning only |
| 5 |
• | QC1DB |
MEDIAN |
0.000576 |
ADU/pix |
VAL | 0,0.0015 |
181 |
slit_b |
this |
last_yr |
all
|
illumination gradient b of central slice, 1x1 binning only |
| 6 |
• | QC1DB |
none |
|
ADU/pix |
none | |
181 |
slit_db |
this |
last_yr |
all
|
error in b, 1x1 binning only |
| |
|
*Data sources: QC1DB: QC1 database; LOCAL: local data source
|
Plot 1
scores:  16| 16|
| | data source: | xshooter_flat
(QC1 database) |
| dataset: | slit_rms | • |
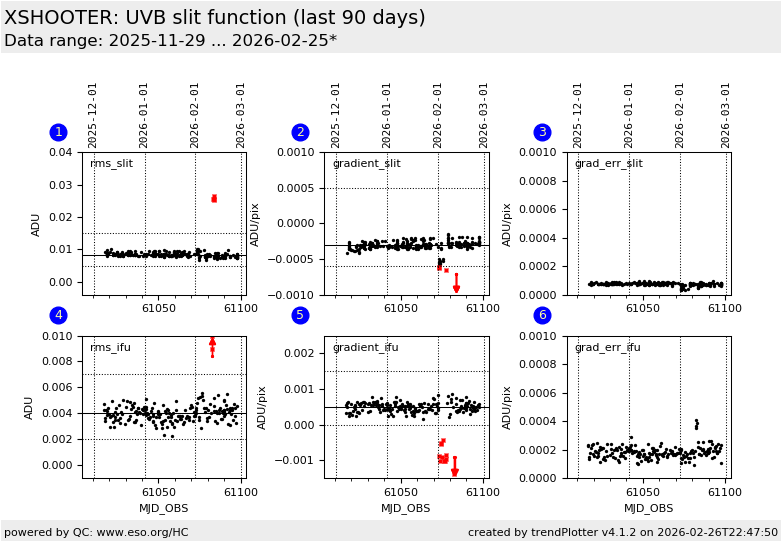
| median: | 0.00792 | ADU |
| fixed thresholds: | 0.005...0.015 | ADU |
| N_data plotted: | 243 |
| [click plot for closeup] |
Plot 2
scores: not implemented
| | data source: | xshooter_flat
(QC1 database) |
| dataset: | slit_b | • |
| median: | -0.000269 | ADU/pix |
| fixed thresholds: | -0.0006...0.0005 | ADU/pix |
| N_data plotted: | 243 |
| [click plot for closeup] |
Plot 3
scores: not implemented
| | data source: | xshooter_flat
(QC1 database) |
| dataset: | slit_db | • |
| average: | none |
| thresholds: | none |
| N_data plotted: | 243 |
| [click plot for closeup] |
Plot 4
scores: 15|
| | data source: | xshooter_flat
(QC1 database) |
| dataset: | slit_rms | • |
| median: | 0.00424 | ADU |
| fixed thresholds: | 0.002...0.007 | ADU |
| N_data plotted: | 181 |
| [click plot for closeup] |
Plot 5
scores: 15|
| | data source: | xshooter_flat
(QC1 database) |
| dataset: | slit_b | • |
| median: | 0.000576 | ADU/pix |
| fixed thresholds: | 0...0.0015 | ADU/pix |
| N_data plotted: | 181 |
| [click plot for closeup] |
Plot 6
scores: not implemented
| | data source: | xshooter_flat
(QC1 database) |
| dataset: | slit_db | • |
| average: | none |
| thresholds: | none |
| N_data plotted: | 181 |
| [click plot for closeup] |
This plot monitors the slit function.
The median of the 21 central rows of the master flat is taken
and a cross section over one order is extracted. (see plot tutorial for details).
For flats in slit mode an analysis region is determined exluding both edges.
For flats in IFU mode the analysis region is confined to the central slice.
Boxes 1 and 4 show the rms of the analysis region.
The analysis region is fit by a linear function
y = a + b * x
where b represents the illumination gradient over the slit.
This QC parameter is given as gradient in box 2 for slits and in box 5 for the central
slice in IFU flats.
The uncertainty of the gradient b, called grad_err, is given in boxes 3 and 6.
Thresholds are based on the experience gained during the 2017-02 events in the UVB-arm
General information
Click on any of the plots to see a close-up version.
The latest date is indicated on top of the plot.
If configured,
- data points belonging to the latest date are specially marked
- statistical averages are indicated by a solid line, and thresholds by broken lines
- outliers are marked by a red asterisk. They are defined as data points outside the
threshold lines
- "aliens" (= data points outside the plot Y limits) are marked by a red arrow (↑ or ↓)
- you can download the data for each parameter set if the 'Data downloads' link shows up
|
