Ursäkta oss! Den här sidan finns ännu inte på ditt språk. Vi visar istället originalversionen.
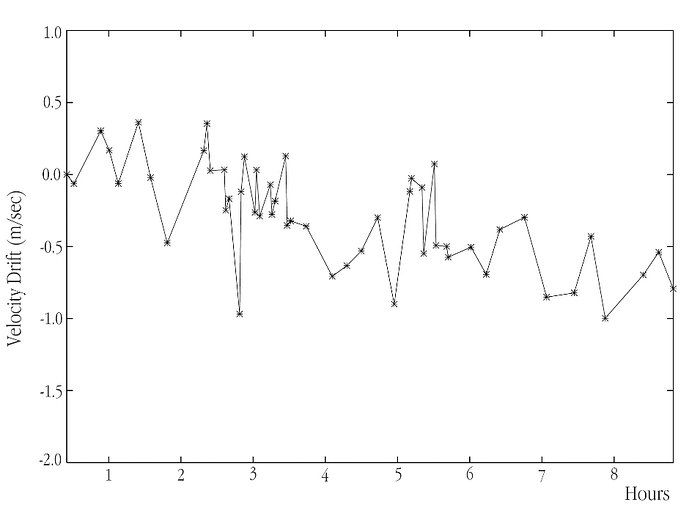
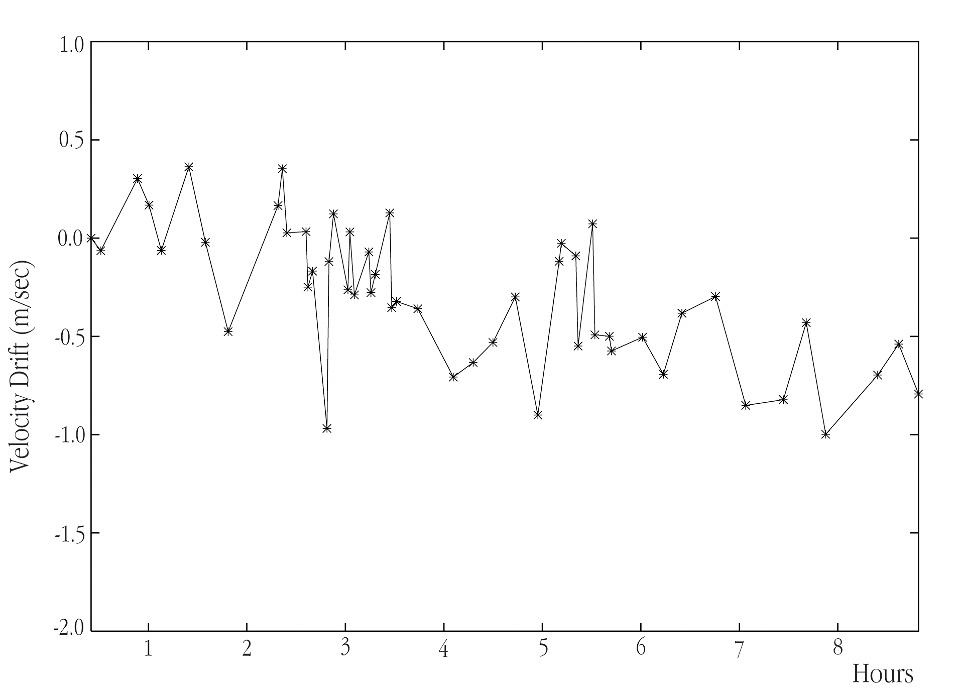
Stability of HARPS velocity measurements during an observing night
Powerful demonstration of the extraordinary stability of the HARPS spectrograph. It plots the instrumentally induced velocity change, as measured during one night (9 consecutive hours) in the commissioning period. The drift of the instrument is determined by computing the exact position of the Thorium emission lines. As can be seen, the drift is of the order of 1 m/s during 9 hours and is measured with an accuracy of only 20 cm/s.
Källa:ESO
Om bilden
| ID: | eso0308e |
| Typ: | Diagram |
| Publiceringsdatum: | 27 mars 2003 |
| Relaterade pressmeddelanden: | eso0308 |
| Storlek: | 1902 x 1369 px |
Om objektet
| Namn: | Spectrograph |
| Typ: | Unspecified : Technology : Observatory : Instrument |
| Kategori: | Illustrations |