Plot
? |
Symb
? |
Source
* |
Average ? |
Thresholds ? |
N_
data |
QC1
parameter |
Data
downloads |
Remarks |
| method |
value |
unit |
method |
value |
| 1 |
• | QC1DB |
MEDIAN |
0.611 |
ADU |
VAL | -6,6 |
82 |
median_master |
this |
last_yr |
all
|
Chip 1, 100Kps/2ports/high_gain, 2x2 |
| 2 |
• | QC1DB |
MEDIAN |
0.278 |
ADU |
VAL | -8.5,3. |
84 |
median_master |
this |
last_yr |
all
|
Chip 1, 200Kps/2ports/low_gain, 2x2 |
| 3 |
x | QC1DB |
MEDIAN |
12.9 |
degree |
VAL | 0,20 |
224 |
ins_focus_temp |
this |
last_yr |
all
|
Temperature at Instrument Focus |
| 4 |
• | QC1DB |
MEDIAN |
0.444 |
ADU |
VAL | -5.,7.5 |
82 |
median_master |
this |
last_yr |
all
|
Chip 2, 100Kps/2ports/high_gain, 2x2 |
| 5 |
• | QC1DB |
MEDIAN |
0.194 |
ADU |
VAL | -10.,3. |
84 |
median_master |
this |
last_yr |
all
|
Chip 2, 200Kps/2ports/low_gain, 2x2 |
| 6 |
x | QC1DB |
MEDIAN |
12.9 |
degree |
VAL | 0,20 |
224 |
ins_focus_temp |
this |
last_yr |
all
|
Temperature at Instrument Focus |
| |
|
*Data sources: QC1DB: QC1 database; LOCAL: local data source
|
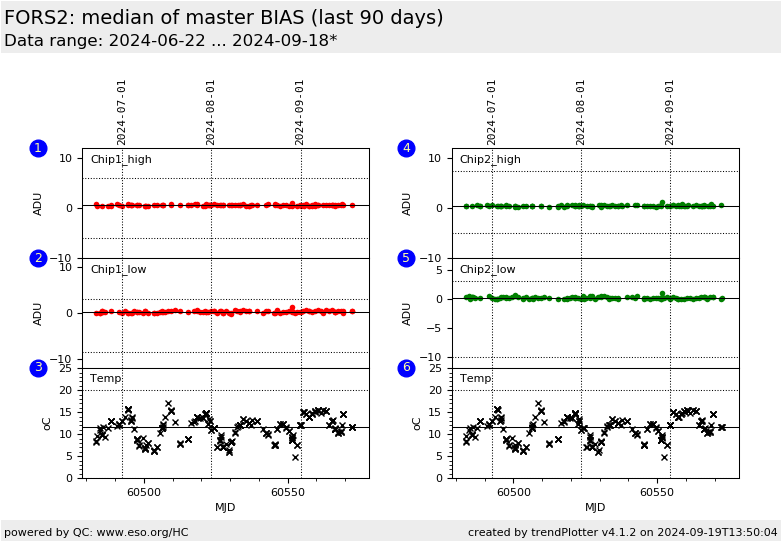
Plot 1
scores:  10| 10|
| | data source: | fors2_bias
(QC1 database) |
| dataset: | median_master | • |
| median: | 0.611 | ADU |
| fixed thresholds: | -6...6 | ADU |
| N_data plotted: | 82 |
| [click plot for closeup] |
Plot 2
scores: 10|
| | data source: | fors2_bias
(QC1 database) |
| dataset: | median_master | • |
| median: | 0.278 | ADU |
| fixed thresholds: | -8.5...3.0 | ADU |
| N_data plotted: | 84 |
| [click plot for closeup] |
Plot 3
scores: not implemented
| | data source: | fors2_bias
(QC1 database) |
| dataset: | ins_focus_temp | x |
| median: | 12.9 | degree |
| fixed thresholds: | 0...20 | degree |
| N_data plotted: | 224 |
| [click plot for closeup] |
Plot 4
scores: 10|
| | data source: | fors2_bias
(QC1 database) |
| dataset: | median_master | • |
| median: | 0.444 | ADU |
| fixed thresholds: | -5.0...7.5 | ADU |
| N_data plotted: | 82 |
| [click plot for closeup] |
Plot 5
scores: 10|
| | data source: | fors2_bias
(QC1 database) |
| dataset: | median_master | • |
| median: | 0.194 | ADU |
| fixed thresholds: | -10.0...3.0 | ADU |
| N_data plotted: | 84 |
| [click plot for closeup] |
Plot 6
scores: not implemented
| | data source: | fors2_bias
(QC1 database) |
| dataset: | ins_focus_temp | x |
| median: | 12.9 | degree |
| fixed thresholds: | 0...20 | degree |
| N_data plotted: | 224 |
| [click plot for closeup] |
The bias level (in ADU) is evaluated as the median value of all pixels in the master bias. As of 2015-04-22 the bias level is given after offset (overscan) subtraction (change after adopting new pipeline v.5). The trending is done for 2x2 binning only. The bottom pannels
show temperature in the focus of the instrument, read from the Chip1 and Chip2 data files. This is to trace any possible correlation of the bias level with temperature. Details can be found in the plot tutorial.
DB Name: fors2_bias
TPL.ID: img_cal_bias
Fits header keyword: QC.MBIAS.LEVEL
QC1 DB parameter: median_master
General information
Click on any of the plots to see a close-up version.
The latest date is indicated on top of the plot.
If configured,
- data points belonging to the latest date are specially marked
- statistical averages are indicated by a solid line, and thresholds by broken lines
- outliers are marked by a red asterisk. They are defined as data points outside the
threshold lines
- "aliens" (= data points outside the plot Y limits) are marked by a red arrow (↑ or ↓)
- you can download the data for each parameter set if the 'Data downloads' link shows up
|
