SINFONI: wavelength
| |
| HC PLOTS |
| Nominal wav:elength for J,H,K,and HK bands |
 |
| Spectral resolving power |
|
| X-position of slitlet #17 |
|
| FWHM of identified spectral lines |
|
| Number of identified spectral lines |
|
| Mean flux (on - off) of arc lamp |
|
| Maximum flux (on - off) of arc lamp |
|
|
QC1 database (advanced users):
browse |
plot
|
Arc lamp frames are used to create and monitor the SINFONI wavelength
solutions and are routinely obtained on a daily basis. Each arc lamp is
exposed in pairs made up of lamp-on and lamp-off frames and are made for each
of the available gratings (J, H, K, and H+K) and pixel scales (25, 100, and
250 mas). They are processed into a number of product frames
 |
A stacked SINFONI wavelength calibration arc lamp. The 32 slitlets are evident in this image.
|
 |
The pipeline-derived wavelength solution applied to the above arc lamp frame results in this resampled WAVE image. This product is solely created for quality control and is used to check the quality of the global dispersion solution.
|
 Parameters trended
QC1_parameters
| FITS key |
QC1 database: table, name |
definition |
class* |
HC_plot** |
more docu |
| QC.COEF0.MED | sinfoni_wave..qc_coef0_med | dispersion coefficient | HC | | [docuSys coming] |
| [calculated by QC procedure] | sinfoni_wave..qc_slit17_x | x-position of slitlet #17 (QC script) | HC | | [docuSys coming] |
| QC.FWHM.MED | sinfoni_wave..qc_fwhm_med | median FWHM | HC | | [docuSys coming] |
| QC.WAVE.ALL | sinfoni_wave..wave_all | | | | [docuSys coming] |
| QC.FRMDIF.MEANFLUX | sinfoni_wave..qc_frmdif_meanflux | mean flux ON-OFF lamp | HC | | [docuSys coming] |
| QC.FRMDIF.MAXFLUX | sinfoni_wave..qc_frmdif_maxflux | max flux in ON-OFF lamp | HC | | [docuSys coming] |
| [calculated by QC procedure] | sinfoni_wave..qc_spec_res_med | median spectral resolution over full wavelength range (QC script) | HC | | [docuSys coming] |
*Class: KPI - instrument performance; HC - instrument health; CAL - calibration quality; ENG - engineering parameter
**There might be more than one. |
Trending
 |
QC report 1
|
 |
QC report 2
|
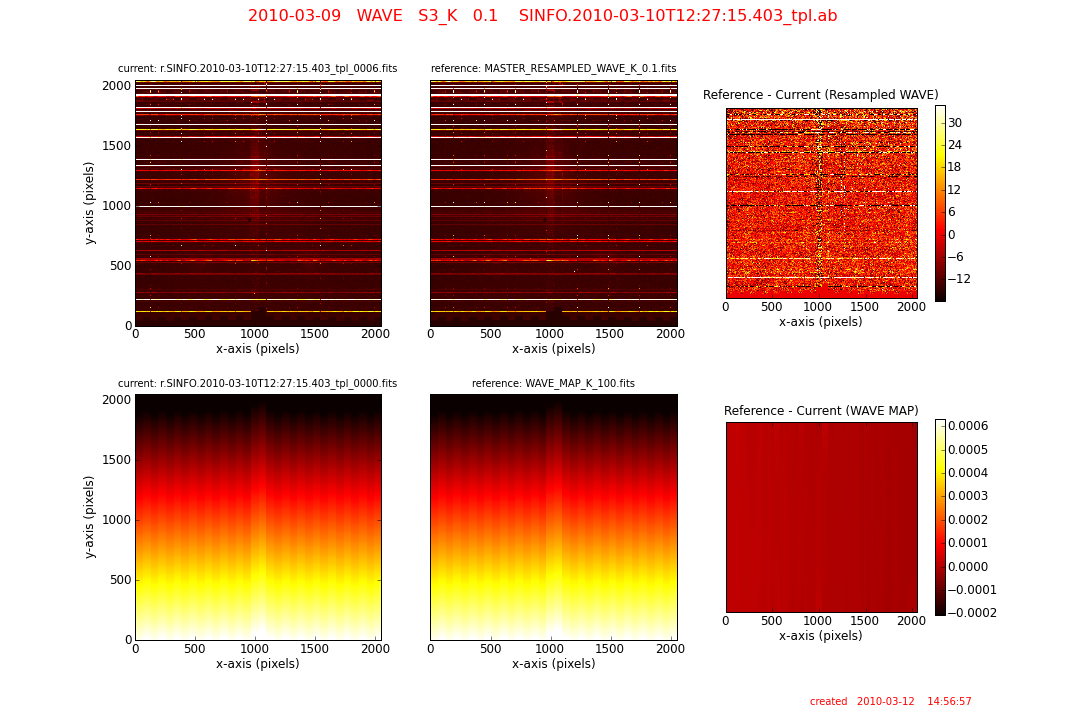
The QC reports for the WAVE include:
QC Report 1 (images):
UL: an image of the current resampled arc line frame (RESAMPLED_WAVE).
UC: an image of the reference resampled arc line frame (RESAMPLED_WAVE).
UR: the difference between the reference and the current resampled arc line frames.
LL: an image of the current pipeline-computed wavelength solution (WAVE_MAP).
LC: an image of the reference pipeline-computed wavelength solution (WAVE_MAP).
LR: the difference between the reference and the current pipeline-computed wavelength solution.
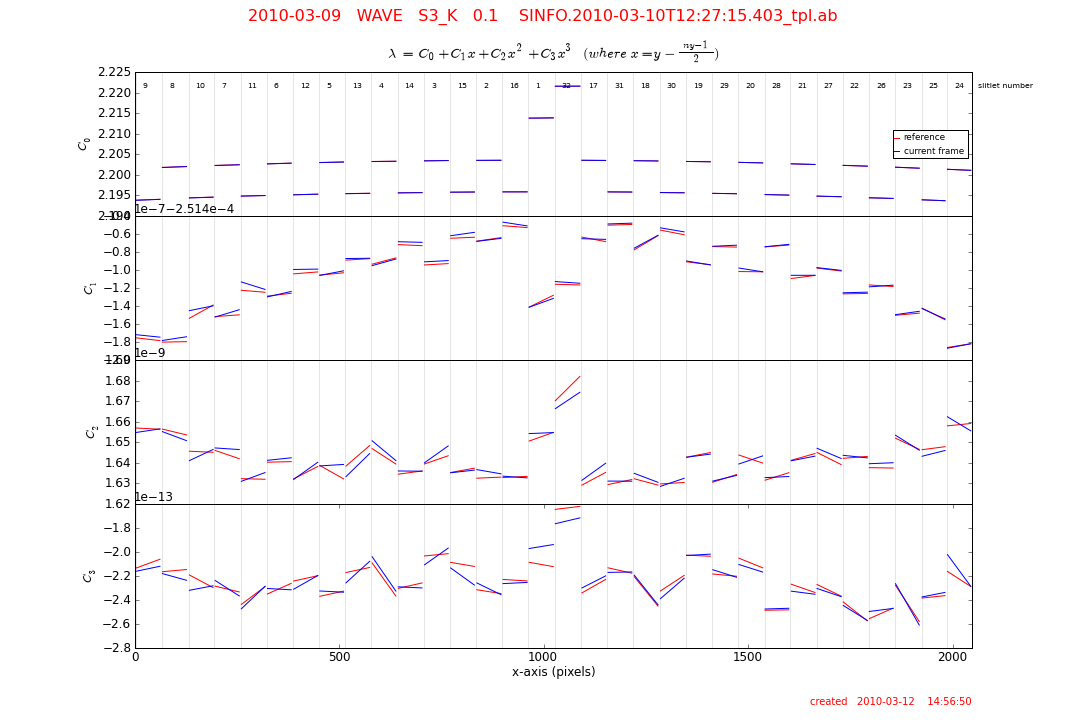
QC Report 2 (coefficients):
This report includes a four panel plot of the coefficients computed for the wavelength solution. The coefficients are defined for each row (y-axis) such that:
lambda = C0 + C1*x + C2*x2 + C3*x3 [where: x = y - (Ny-1)/2, and Ny is the number of y-axis pixels (2048)].
The current (shown in blue) and the reference (shown in red) coefficient values are plotted for each of the 32 slitlets.
top: 0th order coefficient C0.
top center: 1st order coefficient C1.
lower center: 2nd order coefficient C2.
bottom: 3rd order coefficient C3.
|
QC report 3
|
|
QC report 4
|
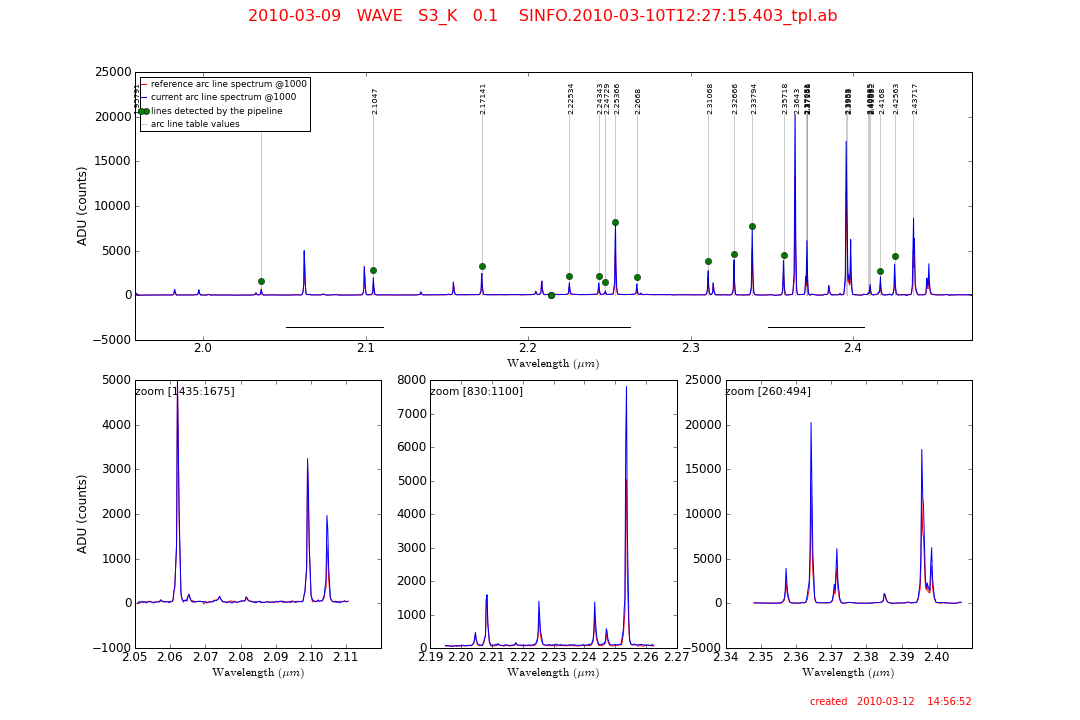
QC Report 3 (arc lines):
This report shows plots of the extracted, calibrated, arc line spectra. The current arc spectra are shown in blue and the reference spectra is plotted in red.
top: the full range arc line spectrum extracted along column pixel 1000. Green dots show which arc lines have been detected by the SINFONI pipeline. All emission lines contained in the arc line reference table are marked with a thin black line and have their wavelengths labelled.
LL: zoomed region 1 of the arc line spectrum. The pixel values of the zoom are given in the top left corner of the frame and the zoom region is shown as a horizontal line in the upper full-scale plot.
LC: zoomed region 2 of the arc line spectrum. As above.
LR: zoomed region 3 of the arc line spectrum. As above.
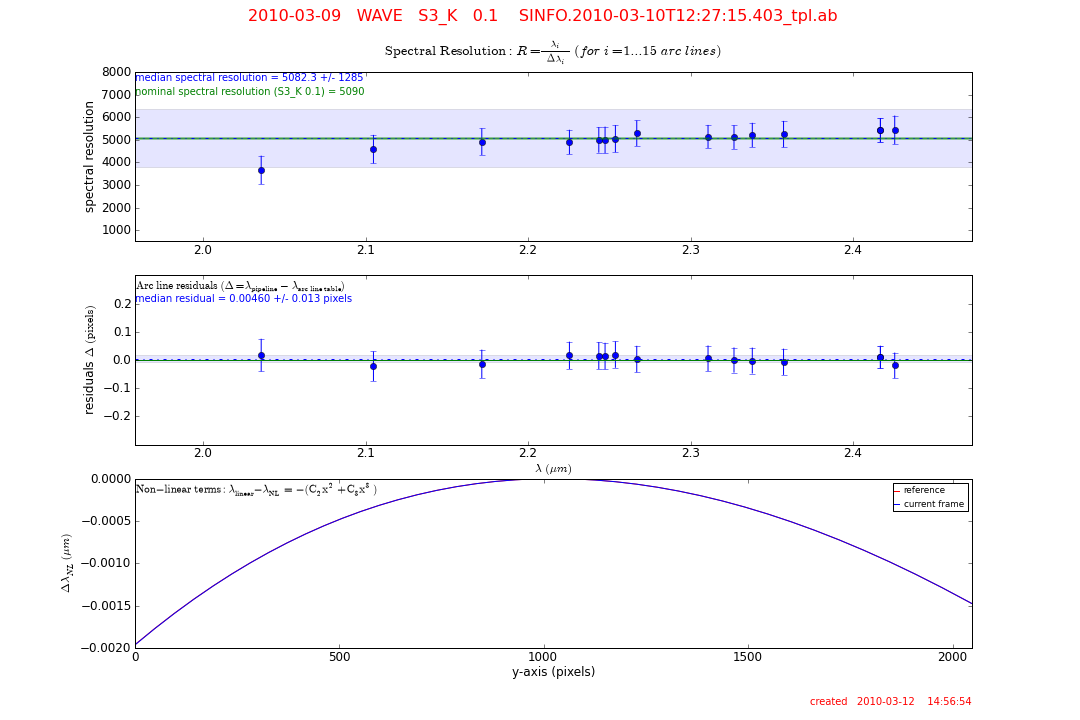
QC Report 4 (spectral resolution and residuals):
top: the spectral resolution as a function of wavelength. The spectral resolution and its error is computed for each arc line detected by the pipeline. The median spectral resolution is shown as a blue dotted line with blue shading indicating the +/- 1 standard deviation range. The nominal spectral resolution (as given by the SINFONI User's Manual, pg. 65), for the given grism and pixel scale, is indicated by a thick green line. Both values are written to the top left of the plot.
center: the arc line residuals are computed from the positional differences between the computed arc line positions and the positions given by the reference arc line table. The residuals are plotted in units of pixels, and the median value is shown as a dotted blue line with blue shading indicating the +/- 1 standard deviation range.
bottom: the non-linear wavelength conversion terms. The non-linear terms are given by:
C2*x2 + C3*x3) [where: x = y - (Ny-1)/2, and Ny is the number of y-axis pixels (2048)]. The blue line indicates the current non-linear terms, while the red line shows the non-linear terms of the reference wavelength solution.
Scoring&thresholds Parameters trended
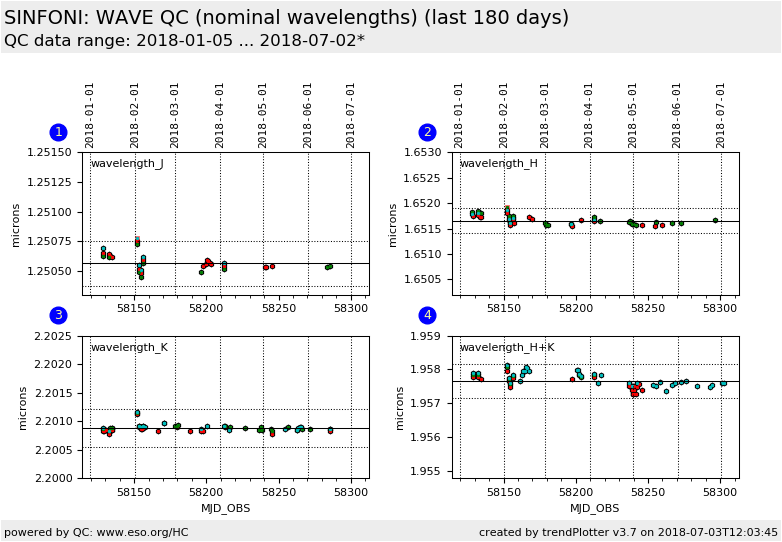 |
central wavelength for each of the four gratings (J, H, K, and H+K) (vertical axis) at three pixel scales (horizontal axis).
|
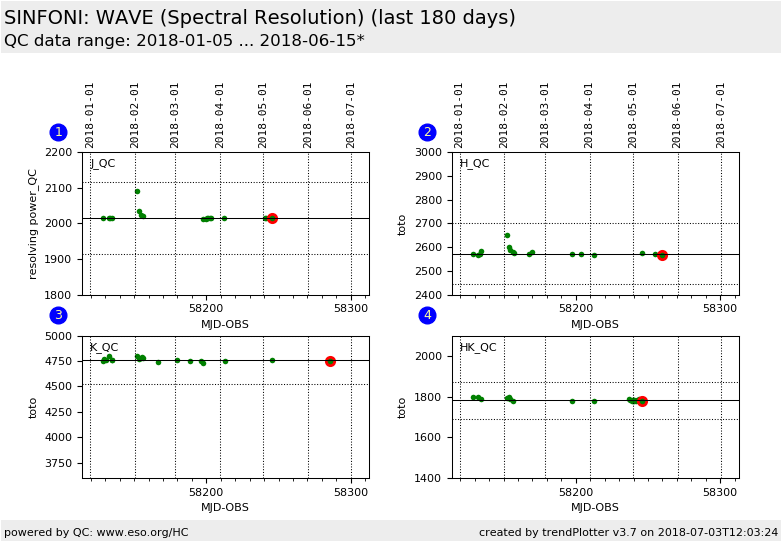 |
spectral resolution for each of the four gratings (J, H, K, and H+K) at a single pixel scale (250 mas).
|
The wavelength dispersion solution derived by the SINFONI pipeline and trended is intended for determining the instrument stability. It is a relatively low-order dispersion solution is based solely on a few detected arc lines. Users processing science data should use higher orders and include sky OH emission lines for higher accuracy dispersion solutions.
History
SINFONI grating wavelengths and resolutions are quite stable. The wavelength rms values are generally better than 2 Angstroem (worst case: 4 Angstroem in H+K) over entire observing semesters. Any slightly larger jumps are only seen following interventions. This can be seen in the FULL wavelength history and the full resolution history.
Algorithm Parameters trended
Based on the position of 15 (J-band) to 28 (H-band) arc lines a third-order wavelength solution is computed. This wavelength dispersion solution is computed for each of the 2048 columns iand specified by four coefficients per column. The parameter qc.coef0.med is the median shift over all columns. The average over the 2048 coefficients is also computed.
The resolving power is computed from the nominal central wavelength divided by the FWHM of the identified arc lines.
The spectral resolution is computed for each arc line detected and the median is computed.
|