

The Venus Transit 2004
... Analysis of the Contact Timing Observations (Summary)
by Jean-Eudes Arlot and Patrick Rocher (IMCCE)
Introduction
The VT-2004 Observing Campaign was based on timing observations of the moments of the four contacts (T1, T2, T3 and T4), i.e., when the periphery of Venus' disc touched the solar limb. Ample instructions were given to the observers via guidelines and hints. The excellent results obtained - as these will be presented below - indicate that most observers took great care to achieve the best possible accuracy with their respective equipment.
Many observers submitted their contact timings already during the transit via a special page at the IMCCE, but some needed more time to measure their photos. There was thus a steady stream of new data in the days and weeks after the transit, until the stipulated deadline on July 10, 2004, after which no further entries were admitted.
Following the receipt of all contact timing data, it is now possible to perform the final calculation of the Astronomical Unit (AU) as determined by the VT-2004 Observing Campaign, by means of various algorithms and after a certain data selection. Details about these procedures are available in the technical Explanatory Note No. 1 and Explanatory Note No. 2 (both as PDF).
So what is the final value of the AU? Is it possible to compare the results in 2004 with those of past centuries? What is the true precision of today's measurements?
Read on to find some answers to these questions!
The database
Most of the observations were made in Europe, but data also arrived from North and South America, Africa, Asia and Australia, cf. see the maps of all registered groups of observers in the world (2763) and in Europe (2427). In total, 4550 contact timings were received from 1510 registered observers . Many of these were delivered on-line during the transit event; the rest before July 10, 2004.
Note that the observers were not situated on the "optimal" geographical sites - in the present context, this means sites with the largest possible "parallax" (the small angle "observing site - Sun - center of the Earth"). Accordingly, the methods by Delisle and Halley were not well suited for use on the present data material. The following table indicates the number of timings received from each continent, by each contact and in total.
| No. of timings | T1 | T2 | T3 | T4 | Total |
| Europe | 676 | 1105 | 1297 | 1137 | 4215 |
| Africa | 8 | 14 | 21 | 20 | 63 |
| Americas | 3 | 3 | 30 | 27 | 63 |
| Asia | 35 | 59 | 60 | 32 | 186 |
| Australia | 9 | 14 | 0 | 0 | 23 |
| Total | 731 | 1195 | 1408 | 1216 | 4550 |
The above numbers correspond to the full database, i.e., including entries which are clearly wrong. Note for instance that the observations of contacts T1 and T2 from the Americas must be wrong in some way, since these contacts were not observable from there. In some cases, timings that obviously corresponded to one particular contacts were erroneously assigned to another contact when the observers entered it into the database.
The final calculations, as these are reported below, were made on the basis of a "cleaned" database, in which the obviously wrong data had been removed. It contains 4367 contact timings by 1440 observers . Moreover, some calculations were done on subsets of observations selected by means of certain criteria that are specified in what follows.
The calculations
The calculation of the Astronomical Unit was made in several ways, using the new possibilities available with powerful computers of the XXIth century and also by means of old methods as they were employed in earlier centuries.
The first method used is the calculation in real-time of the Astronomical Unit (AU) as the fresh data entered the database on June 8, 2004 . This calculation began at the moment of the first entry which provided a value of the AU by solving the question: what should be the value of the AU in order to minimize the difference between the observed timing and the corresponding, theoretical one?
When the next entries arrived, simple average values of the AU were computed. Since the accuracy of the entries (observed timings) could not be known in advance, it was necessary to assume the values of several parameters. This necessarily introduced an important constraint into the algorithm used, otherwise less accurate observations might have resulted in an infinite value of the AU, making it impossible to compute a running average of the AU, as this was done and displayed at the VT-2004 Central Display. In specific terms: the ratios of the distances Venus-Earth-Sun were assumed known, whereby the Sun could never be at an infinite distance.
The second method became possible when the entire database was available . It works like this: Assuming a (starting) value of the AU, predictions are made for the moments of the contacts at all the observing sites, and observed timings which are far off (in time) are eliminated. The remaining timings are then used to determine a new value of the AU, which in turn allow to determine new timing predictions, and so on. This ("iterative") process will converge towards a "final" value of the AU, irrespective of the starting value of the AU (within reasonable boundaries). Interestingly, if this process is started from the well-known value of the AU as determined by radar ranging measurements, it immediately leads to very nearly the same ("true") value of the AU, thus testifying to the quality of the observational material.
The third and fourth methods are those first described by Delisle and Halley . They are based on the use of pairs of observers to determine the distance Earth-Sun through the "parallactic effect" (the "parallax"), that is, the difference of the lines-of-sight from different geographical locations. These methods require knowledge of all the data in order to select optimal pairs of observations (timings) from different sites. However, it soon turned out that the observers in 2004 were not located in an optimal way (i.e. where the parallax is as large as possible), and certainly not as proposed by Delisle or Halley. The corresponding calculations on the 2004 observations by these methods were therefore difficult and did not give very secure results.
The results from the various methods of calculation are given below. They are compared to the currently "best" ("true") value of the Astronomical Unit, as determined by radar measurements: 149 597 871 km .
1. The on-line calculation in real-time on June 8, 2004
During the transit on June 8, observations of timings of contacts were received on-line and a calculation of the AU was made and displayed at the Central Display of the VT-2004 website in real time; see the corresponding Explanatory Note No. 1 (PDF) for more details. It was not possible to use an algorithm based upon Delisle's method since not all data was on hand and since the observations were not made from pre-selected sites.
For this reason, a comparison was made with the theoretical predictions in order to determine one value of the AU for each timing received, i.e., that value of the AU for which the difference between the observed timing and the corresponding calculated timing value is the smallest possible. To ensure convergence of these calculations, also when accepting all the data (including the "wildly" wrong ones!), it was necessary to introduce the reasonable constraint that the value of the AU can not be infinite. The result, using all 4367 timings correctly entered into the database, and with the uncertainty (r.m.s. dispersion) as well as the difference from the "true" value of the AU (deviation) indicated, is:
| Contacts | No. of timings | Calculated value of 1 AU with uncertainty | Difference from "true" value |
| All | 4367 | 149 529 684 km ± 55 059 km | - 68 186 km |
This is therefore the "final" result by means of the first (on-line) method , based on all data received, excluding only the obviously wrong ones.
2. Calculations made on the basis of all data
When all data are available (after the deadline on July 10, 2004), it is possible to decide, by means of objective criteria, which of these observations can be used for the calculation and which of them should not. It is therefore no longer necessary to put particular constraints on the calculation of the AU.
But how is it possible to decide which observations are "good enough" to be included in the calculation and which are not? This is how it was done.
Starting from a given value of the AU, corresponding theoretical (predicted) timings are calculated for each observing site and the difference between this value and the value observed and submitted to the database is computed. Only those data are then kept for which this difference is below a certain value. Depending on the size of the "allowed difference", more or less data will be kept. Excluding the data for which the difference exceeded the "allowed difference", the calculation is then repeated and new theoretical timings are determined for the sites, and so on. In fact, if the calculation is started with the "true" value of the AU, the final result is obtained after only one iteration; more details about this procedure are available in Explanatory Note No. 2.
The calculation was carried out under different conditions:
Condition 1 : observed timings that are more than 8 seconds off the corresponding predicted timings are removed (i.e., those which are outside a time interval of 16 seconds, centered on the predicted timing). The corresponding results, based on the use of timings from the second (T2), the third (T3), and all contacts, respectively, are given in the table below. In the fourth row, the data have been weighted according to the size of the corresponding parallax: timings from sites with larger values of the parallax were given larger weights.
| Contacts | No. of timings | Calculated value of 1 AU with uncertainty | Difference from "true" value |
| T2 | 262 | 149 590 268 km ± 108 359 km | - 7602 km |
| T3 | 421 | 149 226 725 km ± 324 822 km | - 371 145 km |
| All | 1066 | 149 421 803 km ± 252 081 km | - 176 067 km |
| All (weighted) | 1066 | 149 507 347 km ± 173 437 km | - 90 523 km |
Condition 2 : observed timings that are more than 4 seconds off the corresponding predicted timings are removed (i.e., those outside a time interval of 8 seconds, centered on the predicted timing). The corresponding results, based on the use of timings from all contacts, is:
:| Contacts | No. of timings | Calculated value of 1 AU with uncertainty | Difference from "true" value |
| All | 583 | 149 608 708 km ± 11 835 km | + 10 838 km |
The following conclusions may be drawn from these calculations:
- When, as usual, the "best" result is considered to be that with the smallest dispersion, then it is here the one based on observed timings within ±4 seconds from the predictions (Condition 2). In this case, the resulting difference between the calculated and the true value of the AU is also the smallest, only about 11 000 km.
- Note that the difference between the calculated and the true value is smallest when using only timings from the second contact (T2) that are within ± 8 seconds of the predictions (Condition 1; first line in the upper table). The reason for this is the comparatively large parallax for observers in Europe at the time of this contact early in the morning (the angle "observing site - Sun - center of the Earth" is largest possible at sunrise). However, the associated, difficult observing conditions (in particular the comparatively bad seeing - unsharp images - due to turbulence in the atmosphere near the horizon) are reflected in the comparatively large dispersion of the result (± 108 359 km).
- Even though there are more timings of the third contact (T3), the result is not better than that for the second contact (T2). This is because the Sun was high in the sky (and near the North-South meridian that "faces" the Sun) for most observers in Europe at the third contact and the parallax was correspondingly small. In other words, even a good T3-timing measurement from Europe did not constrain well the value of the AU.
- The result is slightly improved when the timings are weighted by observing site (i.e. by the size of the parallax; Condition 1 - fourth line). However, the number of well-situated sites (in Australia, Siberia,...) is too small to achieve a large improvement.
The final result for the second (non-constrained) method is therefore that based on all timings that are within ± 4 seconds of the prediction:
| Contacts | No. of timings | Calculated value of 1 AU with uncertainty | Difference from "true" value |
| All | 583 | 149 608 708 km ± 11 835 km | + 10 838 km |
This result is clearly better than the one obtained in real-time since less accurate observations were eliminated. Nevertheless, test calculations with elimination of even more observations (by narrowing the time interval) do not give a better result - there are then too few data and their distribution is no longer normal (Gaussian).
3. Calculations with Delisle's method
With all data at hand, it is also possible to use Delisle's method to deduce a value of the AU, that is, by pairing timing observations two by two. More details about this procedure are available in the Explanatory Note No. 2.
The following table displays the main results by this method, based on timings within ± 8 seconds from the prediction (i.e., within an interval of 16 seconds, centered on the prediction). The calculations were done in the same way as explained above, by assuming a certain value of the AU to start with. Again, the solution converged after a few iterations. When starting with the "true" value of the AU, no iteration at all was necessary.
| Contacts | No. of timings | Calculated value of 1 AU with uncertainty | Difference from "true" value |
| T1 | 103 pairs | 149 593 369 km ± 1 308 668 km | - 4501 km |
| T2 | 1531 pairs | 149 604 208 km ± 535 661 km | + 6338 km |
| T3 | 1979 pairs | 150 623 168 km ± 423 861 km | + 1 025 298 km |
| T4 | 773 pairs | 148 904 105 km ± 534 664 km | - 693 765 km |
| All | 4386 pairs | 149 840 958 km ± 310 577 km | + 243 088 km |
The following conclusions may be drawn from these calculations:
The dispersion decrease when combining all the contacts (fifth row of the table), and the corresponding value of the AU may therefore be considered as the final result by means of Deslisle' method :
| Contacts | No. of timings | Calculated value of 1 AU with uncertainty | Difference from "true" value |
| All | 4386 pairs | 149 840 958 km ± 310 577 km | + 243 088 km |
4. Calculations with Halley's method
Halley's method is based on measuring the duration of the transits from several well-located geographical positions, i.e., sites from where the total duration of the transit varies as much as possible. In general, this corresponds to the north-south direction. A great advantage of this method is that it is not necessary to know the absolute time-scale, e.g., the Universal Time. This was of great importance during the transits observed in earlier centuries, when accurate timing (after long journeys) was a major problem. The major difficulty is that this method implies the need to observe the beginning AND the end of the transit. This condition limits the number of possible sites to those where all contacts are visible and makes successful observations too dependent on the meteorological conditions.
For the transit on June 8, 2004, and thanks to the favourable weather in Europe, about 2000 observers witnessed the beginning and the end of the transit. More than 1500 observers reported their timings, but they were mostly located in Europe and hence geographically quite close to each other. However, Halley's method needs observers that are widely dispersed. In fact, only 10 were well situated for Halley's method to be applied and none of them achieved a sufficient accuracy to produce good results by this method.
Halley's method may best be applied if the maximum of visibility of a transit is from the Americas. In that case, it is possible to find optimally located observing sites, as these continents stretch over a very long North-South arc. In 2004, the "best longitude" ranged from Siberia to the Indian Ocean, i.e., not very favourable for the application of Halley's method.
5. Other results
It is also possible to consider the AU as a known parameter and to introduce the radii of the Sun and Venus as unknowns to be determined from the timing observations.
Corresponding calculations were made with the above mentioned 1066 ("best") observations and the interesting result is as follows:
| Object | Calculated radius with uncertainty | Difference from "true" value |
| Sun | 695980.7 km ± 806 km | 8.6 km |
| Venus | 6052.3 km ± 7.0 km | 0.5 km |
As can be seen, despite the comparatively large uncertainties, the present calculation does give values of the radii which are quite close to the "true" values.
Comparison of the determinations of the AU by means of timings of the present and previous Venus Transits
The following table presents an overview of the results obtained from observations made during previous transits of Venus. As above, the "true" value of the Astronomical Unit is that determined by radar measurements: 149 597 871 km .
| Transit(s) | Author/Computer | Calculated value of 1 AU with uncertainty | Difference from "true" value |
| 1639 | Horrocks | 94 000 000 km | - 55 597 870 km |
| 1761 | Pingré and Short | 138 540 000 km ± 14 400 000 km | - 11 057 871 km |
| 1761 and 1769 | Lalande and Pingré | 151 000 000 km ± 1 500 000 km | + 1 402 129 km |
| 1761 and 1769 | Newcomb (1890) | 149 670 000 km ± 850 000 km | + 72 129 km |
| 1874 and 1882 | Newcomb (1890) | 149 670 000 ± 330 000 km | + 72 129 km |
| 2004 | VT-2004 programme | 149 608 708 ± 11 835 km | + 10 838 km |
Note that even though quite a few observations were made in the past centuries (100 observations in 1761, 120 in 1769, 71 in 1874 and 85 in 1882), only a few of the "best" ones were used for the calculations, from about 10 to 30, depending on the authors. The errors indicated in the above table are estimates: no error calculations were available for the earlier transits, since the theory of errors was only developed at the beginning of the XXth century. The AU-values from the transits in the earlier centuries are all based on a value of 6378.14 km for the radius of the Earth.
The comparison between these results shows that:
- Before the XVIIIth century, the value of the AU and hence the distance to the Sun, was strongly underestimated.
- Following the transit of 1761, the AU was still not well determined but the situation improved significantly after the transit of 1769. Moreover, a new calculation by Newcomb in 1890, based on the observations from 1761 and 1769 but correcting the wrong longitudes used for the calculations in the XVIIIth century by Pingré and others, now led to an accurate value of the AU. This value was not improved by the observations of transits of the XIXth century, only the errors decreased.
- The measurement error decreases with time; this is obviously due to technological progress.
The results from the first transit in the XXIth century are obviously the "best" (in terms of accuracy), despite the relative lack of experience of most of the observers and notwithstanding a random distribution of the observing sites, caused by the absence in 2004 of any specific planning as this was done in earlier centuries. This success is undoubtedly mainly due to:
- the use of GPS and/or accurate maps to know the geographic coordinates of the observing sites with superior accuracy,
- the availability of Universal Time to all observers,
- good optical quality, also of amateur telescopes, reducing the adverse influence of, e.g., the "Black Drop" effect,
- the possibility to obtain superb images by means of very short exposures with CCD (video) cameras, and
- the availability of image processing software to further improve the definition of the moments of contacts and hence to measure the corresponding timings in an objective way.
Conclusions
The VT-2004 programme set up a unique, international network of observers to observe the Venus Transit event on June 8, 2004 wihtin the VT-2004 Observing Campaign . One of the stated goals was to re-enact the historical determination of the distance to the Sun (the Astronomical Unit) by collecting timings of the four contacts made by these observers and combining them in a calculation of the AU.
This project was complex and required much preparation, both for the proper conduction of the observations, the reporting system and the subsequent evaluation of the obtained observational data. It was not clear from the outset how all of this would work.
On the basis of the results reported here, it is clear that the VT-2004 Observing Campaign did reach the stated goals. Above all, perhaps, it demonstrated to young pupils, students, amateurs as well as the general public how a large-scale international collaboration allows to make scientific measurements of good quality.
The on-line results (which were necessarily constrained to avoid non-convergence due to "bad" observations unavoidable in a data base as large and non-uniform as this one) already pointed to the surprisingly good timings made by most observers. However, following the complete and careful evaluation of the entire database, it is an interesting and unexpected, indeed gratifying conclusion that this unique global effort of thousands of mostly amateur observers finally achieved a result that is more accurate than that by professional astronomers at previous transits. Enormous technological progress is the obvious answer, in particular in terms of instruments and communication.
In a nutshell, even if we had not known the distance to the Sun before the Venus Transit 2004, we would have been able to measure it with an accuracy of one hundredth of a percent by means of the observations made by the many participants all over the world! Thank you to everybody - we can be proud of this joint achievement!
The next Venus Transit will happen only eight years from now, and the experience from the present pilot programme will benefit an attempt to further improve the result in 2012:
- by optimizing the locations of the observing sites on the Earth, paying more attention to the recruitment of observers in areas where the parallax is larger, thereby also improving the prospect of using Deslisle's and Halley's methods with more success than this time, and
- by using well-designed criteria for the selection of data for the real-time calculation, based on the actual accuracy of the observations in 2004, and thereby making it possible to avoid the use of a constrained algorithm as this was done this time with the benefit of showing all observers the real quality of their measurements on-line. .
Perform your own calculations!
You may repeat these calculations yourself by means of the databases and the special software that are now available on-line. More information will be found on this webpage at the IMCCE (Paris).
More information
More information about these calculations are contained in some other documents, listed below in order of increasing complexity:
- Brief Summary of the VT-2004 Determination of the AU ("Theme of the Week" - November 1 - 8, 2004)
- Observing Campaign Results
- Explanatory Note No. 1: The On-Line Calculation of the AU (PDF)
- Explanatory Note No. 2: Calculation of the AU by means of the Entire Data Set (PDF)
Related maps:
- Locations of 2763 registered observing teams in the world
- Locations of 2427 registered observing teams in and around Europe
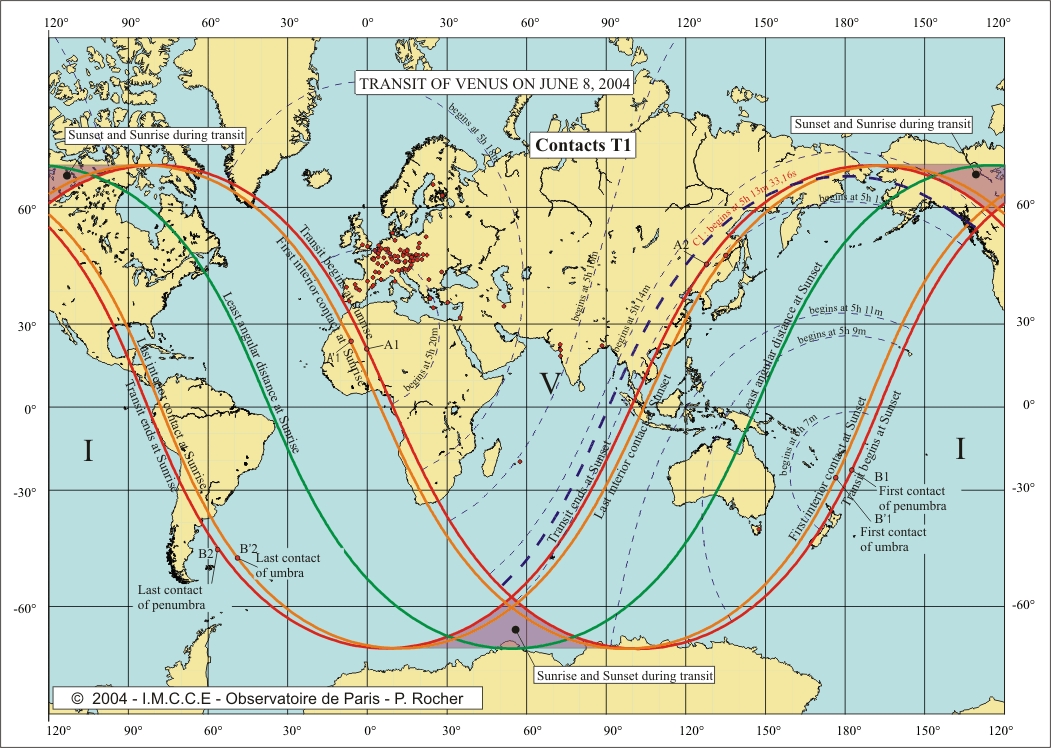
- Circumstances of the First Contact (T1) - please consult Explanatory Note No. 2 for details
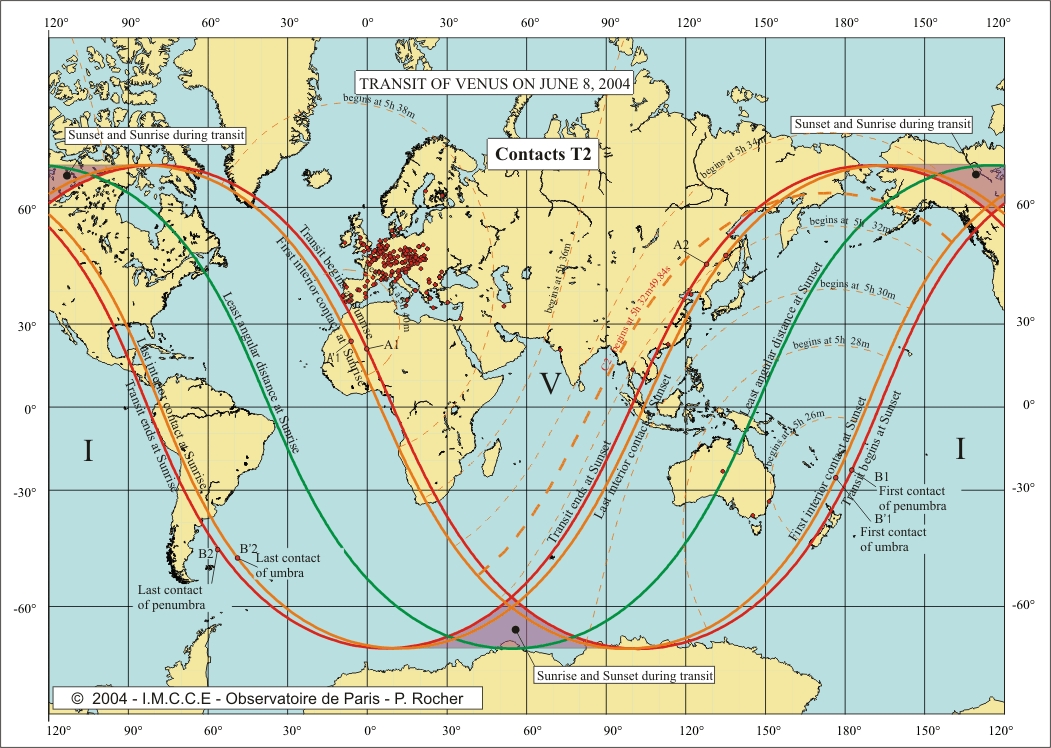
- Circumstances of the second Contact (T2) - please consult Explanatory Note No. 2 for details
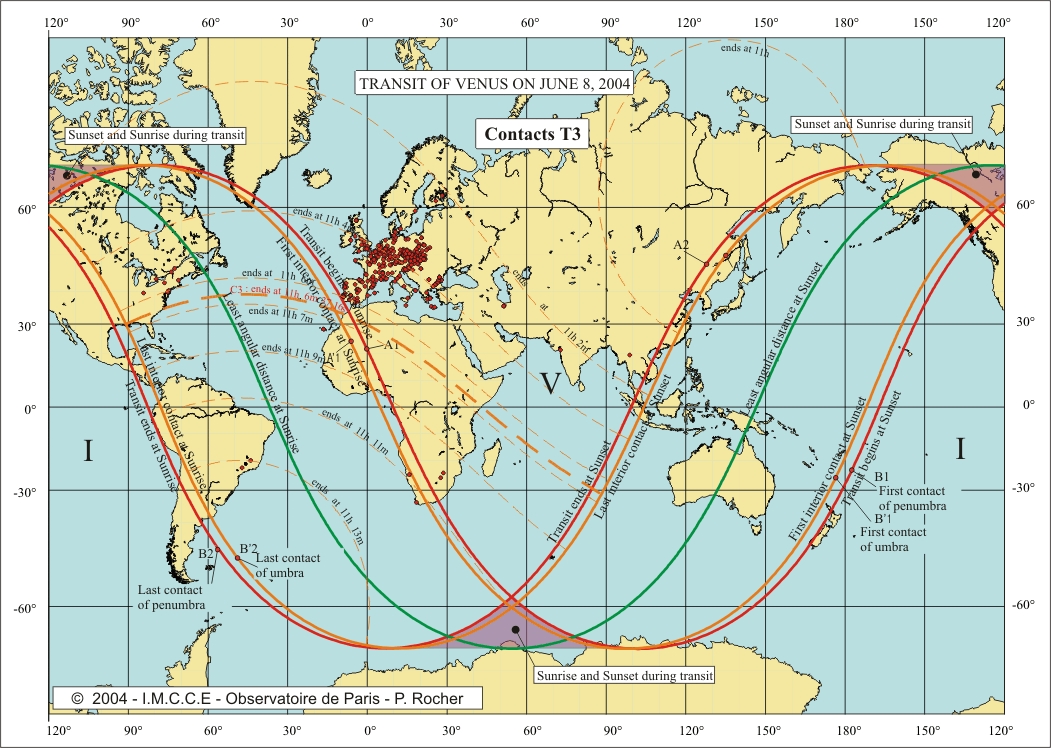
- Circumstances of the Third Contact (T3) - please consult Explanatory Note No. 2 for details
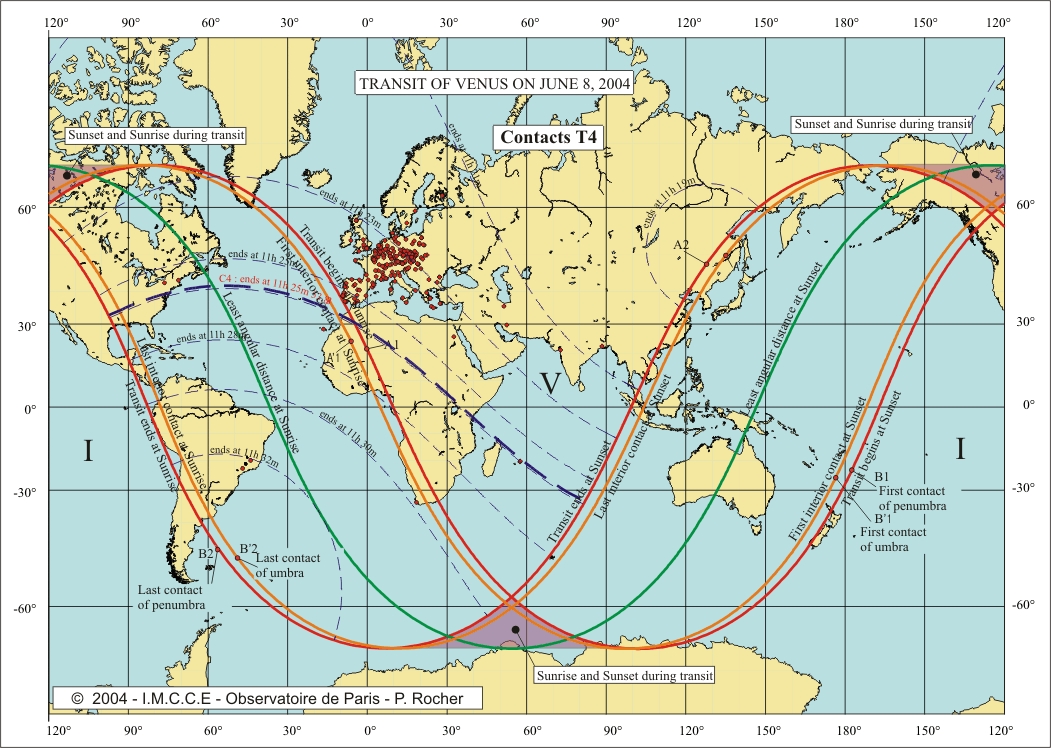
- Circumstances of the Fourth Contact (T4) - please consult Explanatory Note No. 2 for details