GIRAFFE: Wavelength solution and resolution
| |
| HC PLOTS |
| Resolution: |
 |
| Residual RMS: |
|
| Number of lines: |
|
|
QC1 database (advanced users):
browse |
plot
|
The quality of the dispersion solution depends on the quality of the
arclamp exposure and of the pipeline recipe. The arclamp exposure is
quality-controlled
in the arclamp
plot. The results of the pipeline recipe are monitored here, in
terms of three
parameters:
- resolution,
- residual rms,
- number of detected emission lines.
 Resolution
The resolution of the GIRAFFE gratings
is monitored by measuring the width of the identified
and accepted arc emission lines in arclamp calibration data. The QC1 parameter mean_resol
measures the fibre-averaged width of the fitted emission lines.
QC1_parameters
| FITS key |
QC1 database: table, name |
definition |
class* |
HC_plot** |
more docu |
| QC.RESOL.MEAN | giraffe_wave..mean_R | mean resolving power R = ins_grat_wlen/mean_resol | KPI |  |    |
*Class: KPI - instrument performance; HC - instrument health; CAL - calibration quality; ENG - engineering parameter
**There might be more than one, always check the link 'HC'. |
Trending
The upper panel of the trending
plot monitors the HC data taken in
high resolution (H525.8B, all five fibre systems), the lower panel those for low
resolution (L543.1, Medusa1 and 2 only).
History
| Date |
event |
| around 2008-01-14 | Low flux observed, due to bad positioning of the calibration mirror located inside of the OzPoz calibration unit |
| 2010-07-13...24 | problems with gripper, calibration no flux |
| 2015-02 | Focus of the gratings (in particular of the HR grating) re-aligned. See the FULL plots for residual RMS | number of lines | resolution and Science Newsletter |
| 2015-11-27 | strong earthquake, affecting the grating alignment of GIRAFFE (all slit systems) and the quality of the reference dispersion solutions (Medusa2 only). New static calibrations available after complete set of calibrations acquired on 2015-12-06. |
| 2016-10-01 | As a result of the re-alignment in 2015-02, the scatter in the plots has become much less, and we have reduced the threshold ranges to +/-10% (empirical value). Before it was at +/-15% or even higher, due to the strong scatter. |
In February 2015, the gratings (in particular the HR grating) were re-aligned. The alignment had degraded since about 2010.
After the intervention, the resolution was improved by roughly 10% and is now back to the values it had initially.
See the FULL plots for residual RMS | number of lines | resolution.
See also the article in the Science Newsletter.
Scoring&thresholds Resolution
The thresholds are relatively tight and set to be indicative of a sudden degradation (due to misalignment).
Algorithm Resolution
mean_resol (QC1 parameter QC.RESOL.MEAN) is transformed into the resolving power R=λ/mean_resol.
Residual RMS
The arc lamp data are measured in a pattern involving
two health check settings: the high-resolution H525.8B setup, and the low-resolution
L543.1 setup. The former is measured in every slit system, the latter only in the
two Medusa's. The pattern repeats every week.
QC1_parameters
The QC1 parameter rms_fit
(PRO.WSOL.RMS) describes the rms of the residuals of the accepted line
positions against the dispersion solution.
| FITS key |
QC1 database: table, name |
definition |
class* |
HC_plot** |
more docu |
| PRO.WSOL.RMS | giraffe_wave..rms_fit | Average RMS [pxl] of fitted line positions | KPI | | |
*Class: KPI - instrument performance; HC - instrument health; CAL - calibration quality; ENG - engineering parameter
**There might be more than one, always check the link 'HC'. |
Trending
The trending
plot monitors the HC data taken in
high resolution (H525.8B, upper panel) and low resolution (L543.1, Medusa1 and 2 only,
lower panel).
History
| Date |
event |
| around 2008-01-14 | Low flux observed, due to bad positioning of the calibration mirror located inside of the OzPoz calibration unit |
| 2010-07-13...24 | problems with gripper, calibration no flux |
| 2015-02 | re-alignment of the focus of the gratings (in particular of the HR grating). The rms_fit values are back to their initial low values. See the FULL plots for residual RMS. |
| 2015-11-27 | strong earthquake, affecting the grating alignment of GIRAFFE (all slit systems) and the quality of the reference dispersion solutions (Medusa2 only). New static calibrations available after complete set of calibrations acquired on 2015-12-06. |
Scoring&thresholds Residual RMS
The thresholds are set empirically, following the observed behaviour and
taking into account two effects: a) the intrinsic scatter of the parameter due
to slight changes of the spectral format (thermal motions of the gratings),
and b) the longer-term evolution of the parameter due to degrading grating adjustment.
Algorithm Residual RMS
- identify and accept the emission lines from the arclamp per fibre;
- measure their position;
- fit a polynomial;
- calculate the residuals against this fit.
Number of lines
This parameter is derived by the pipeline from the same set of Health
Check data as the residual RMS: arclamp
file in high resolution (H525.8B) and low resolution (L543.1, Medusa1 and 2 only).
QC1_parameters
| FITS key |
QC1 database: table, name |
definition |
class* |
HC_plot** |
more docu |
| PRO.WSOL.NLINES | giraffe_wave..nlin_acc | average number of accepted emission lines per fibre | HC | | |
*Class: KPI - instrument performance; HC - instrument health; CAL - calibration quality; ENG - engineering parameter
**There might be more than one, always check the link 'HC'. |
Trending
The upper panel of the trending plot
shows the number of accepted lines for the HC settings for
high resolution:
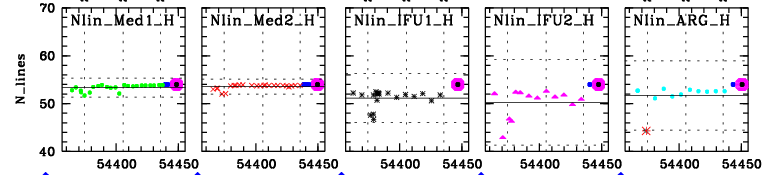 |
Boxes 1-5: Number of accepted lines, high-resolution setting H525.8B.
|
Plots 6-7 show the results for the HC settings for the low resolution
grating:
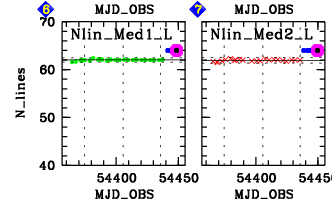 |
Boxes 6,7: Number of accepted lines, low-resolution setting L543.3 and Medusa1/2.
|
For the other settings, this parameter varies strongly. Therefore it is not possible
to provide a trending for each individual setup, but there are three plots which monitor
the chromatic dependence of nlin_acc:
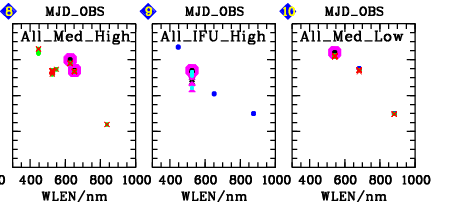 |
Boxes 8-10: Number of accepted lines vs. central wavelength; high-resolution settings (all Medusa1/2); high-resolution settings (all IFU1/2 and Argus); low-resolution settings (all Medusa1/2).
|
History
| Date |
event |
| around 2007-10-01 | arclamp flux strongly decreased due to gripper problem; this resulted in a loss of some of the weaker emission lines, nlin_acc dropped. |
| around 2008-01-14 | Low flux observed, due to bad positioning of the calibration mirror located inside of the OzPoz calibration unit |
| 2010-07-13...24 | problems with gripper, calibration no flux |
| 2015-02 | re-alignment of the focus of the gratings (in particular of the HR grating). The N_lines values are back to their initial high values. See the FULL plots for number of lines. |
| 2015-11-27 | strong earthquake, affecting the grating alignment of GIRAFFE (all slit systems) and the quality of the reference dispersion solutions (Medusa2 only). New static calibrations available after complete set of calibrations acquired on 2015-12-06. |
| 2016-10-01 | >As a result of the re-alignment in 2015-02, the scatter in the plots has become much less, and we have reduced the threshold ranges to +/-10% (empirical value). Before it was at +/-15% or even higher, due to the strong scatter. |
Scoring&thresholds Number of lines
The thresholds are set relatively tightly, around the current mean value. The
QC1 parameter is sensitive to the proper alignment. When the lower threshold
is violated this indicates clearly a degradation of the effective spectral
resolution. This is clearly visible by comparison to the resolution and
rms_fit plots.
Algorithm Number of lines
Lines are identified using a line catalogue, using a noise threshold for weak
lines and rejecting saturated lines. Lines not passing a blending criterion
are rejected, all others accepted.
|
