
The VLT primary mirrors
The VLT primary mirrors: mirror production and measured performance
European Southern Observatory
REOSC - Groupe SFIM
The primary mirrors of the ESO 8-m class Very Large Telescopes are actively supported, thin Zerodur menisci, 8-.2-m diameter. The mirror blanks are produced by SCHOTT; the optical figuring, manufacturing and assembling of interfaces and auxiliary equipment are done by REOSC. Three mirror blanks have already been delivered by SCHOTT to REOSC. In November 1995 the project met a critical and very successful milestone, with the completion and testing of the first finished VLT primary mirror at REOSC. Specifications, manufacturing and above all testing methodology will be addressed, and the final results will be detailed. Optical performance at telescope level will be assessed as well.
Keywords active mirror,fabrication, testing, optical performance
1. INTRODUCTION
The 8.2-m Zerodur primary mirrors (figure 1) of the ESO Very Large Telescope are 175 mm thick and their shape is actively controlled (active optics) by means of 150 axial force actuators,the necessary active corrections being obtained from wavefront sensors located off-axis on the image surface. The 23-tons mirror blanks (figure 2) are procured from SCHOTT Glaswerke and the optical figuring from REOSC (subsidiary of Groupe SFIM), together with the interfaces with the mirror cell and auxiliary equipment such as transport containers. REOSC responsibility starts at the delivery of the mirror blanks at SCHOTT premises and ends at the delivery of the finished mirrors ex works. Dedicated facilities were built by the two companies to execute their respective contracts.
Procurement of the mirror blanks started in 1988with the signature of the SCHOTT contract. The first mirror blank was delivered to REOSC in July 1993, the second in November 1994 and the third one in September 1995. The delivery of the last mirror blank is scheduled for September 1996.
The contract with REOSC for the optical figuring was formalized in 1989. Polishing of two mirrors has been completed;the first one was verified in October-November 1995 and the second is undergoing final tests at the time of redaction of this article.After active correction these two first mirrors are diffraction-limited at Ha wavelength.
The successful production of these mirrors represents a major breakthrough not only in terms of manufacturing processes but also in terms of metrology. Indeed the accurate and reliablemeasurement of a thin, flexible 50m2 optical surface represents a serious challenge.
After reviewing the specifications of the primary mirrors, manufacturing and testing plans will be presented andthe results obtained with three blanks and two finished mirrors will be detailed.
 Figure 1 Figure 1 |
 Figure 2 Figure 2 |
2. SPECIFICATIONS
The essential requirement for the optical performance of the primary mirror is that it shall not impair the image quality permitted by atmospheric turbulence, even under the very best seeing conditions which may occur at the observatory site. This requirement applies at any wavelength. Hence the mirror specification will take into account the disturbing role played by atmospheric turbulence.
The mirror being actively controlled, low spatial frequency terms can be subtracted from the overall wavefront error.In the telescope these low spatial frequency terms are dealt with by an appropriate offset of the support forces. For the VLT primary mirrors, active optics is achieved by modal corrections i.e.,the measured deformation is fitted with the mirror's eigenmodes(up to 16) and the necessary correction forces are deduced linearly from the eigenmodes coefficients.
The total active forces budget for the active optics correction capability of the unit telescopes is in the 800 N range(compression forces only). Of these 800 N a budget of ±120N was allocated for the figuring errors of the primary mirrors.The support system effectively used in the telescope is designed to reach a few grams accuracy. The support system used by the optical manufacturer for the purposes of manufacturing and testing does not require an accuracy better than about 2 Newton, which is sufficient to allow accurate wavefront measurements.
The optical quality specification after active correction is in-line with the formalism developed at ESO to assess telescope performance. It can be demonstrated that the peak signal in the long-exposure Point Spread Function of a large ground-based telescope is given by

where tais the transmissivity of the atmosphere, r0 the atmospheric coherence length, ttthe transmissivity of the telescope optics, D its diameter and CIR the Central Intensity Ratio defined by
where  0 is the Strehl ratio of the telescope, solely taking into account the effect of atmospheric turbulence, and
  the same quantity, after that telescope errors have been taken into account. Relation (1) does not apply in photon-limited regime and assumes an exposure time long enough to average out seeing speckles (typically 10 seconds or more).
Relation (1) shows that a loss of optical qualityor of surfaces reflectivity reduce signal throughput in the same manner as a reduction of collecting area.
CIR-based specifications have a better fidelity with respect to final image properties than specifications based on angular resolution or geometrical optics (e.g. geometrically encircled energy). The essential reason is that, the CIR being proportional to the integral of the Modulation Transfer Function over the entire angular frequency range of the telescope, its variation reflects contrast degradation at all angular frequencies. Hence a high CIR implies high signal throughput, high contrast, small image size. It shall be noted that the opposite statement is incorrect:small image size (e.g. Full Width at Half Maximum) does not necessarily imply high contrast and therefore does not reliably and accurately characterize optical quality.
The specification for high spatial frequencies requires that after a perfect active correction with the 16 first eigenmodes,the remaining errors do not degrade the peak intensity in the long-exposure Point Spread Function by more than 18%, with a wavelength of 500 nm and an atmospheric coherence length r0 of500 mm (seeing angle 0.2 arc second full width at half maximum).Hence the optical quality specification for the primary mirroris
after perfect active correction of the 16 lowest spatial frequency eigenmodes of the mirror. Under more frequent and still excellent seeing conditions, e.g. 0.4 arc seconds, the CIR should be higher than 0.95 (in first approximation the CIRis proportional to the square of the ratio of the RMS wavefront slope error of the telescope divided by the seeing angle).
3. PROCESSES
The mirror blanks are produced by spin-casting. The process (figure 3) starts with the casting of approximately 45tons of glassy Zerodur into a concave mold. Thereafter the mold is transported onto a rotating platform where it is spun until solidification. When the temperature has decreased to about 800ºC and the viscosity is such that the blank will retain its meniscus shape, it is brought into an annealing furnace where it is cooled down to room temperature in about 3 months.
Unmolding is a critical operation which has required the design of a sophisticated handling tool. The latter consists of an array of 18 actuated suction cups which allow the mirror to be handled within extremely low external stresses.
The first surface to be machined is the convex surface,onto which a thin crystalline layer has build up during annealing.This layer having a different coefficient of thermal expansion than the bulk of the substrate, may endanger the integrity of the blank and must be removed first. Therefore the first operation after unmolding is to turn the mirror convex surface up an lay it down onto the machine.
The blank is turned back concave surface upwards and the concave surface machined. Thereafter it is brought back into the furnace for the ceramization cycle, which takes approximately 9 months. Then it is machined again down to final shape unless a fine-annealing cycle is still required to achieve the extremely low residual stresses of the final product.
After packing into the transport container the blank is transported by the optical manufacturer to its premises, down the Rhine river to Rotterdam, then along the coast to Calais and up the Seine to Evry. The last kilometers form the harbor to REOSC premises are done overnight by road, on a hydraulic platform.
Figure 4 shows the outline of the tasks of the optical manufacturer and the associated verification processes.
After unloading of the container at REOSC premises,the first task of the optical manufacturer will be to glue 450invar pads onto which will be mounted the 150 tripod interfaces with the mirror cell. The mirror axial support system consists in an array of 150 pneumatic supports (figure 5) having the same distribution and interface with the mirror as the support system of the final mirror cell.
Mounting of the axial interfaces takes about two months, after which the mirror is ground spherical with large,stiff tools, then a spherical with flexible tools of diameters ranging from 1 to 4 meter.
The computer-controlled figuring process of REOSC consists in adjusting the tool speed to provide the wear pattern corresponding to the material to be removed, in accordance with the measured surface deviations. At the grinding stage, the mirror surface is mapped by spherometry down to sub-micron accuracy.
 |
 |
 |
 |
| Figure 3 | Figure 4 | Figure 5 | Figure 6 |
Figure 6 shows the mirror at the grinding stage.The tool (near the center of the image) is moved by a robot arm while the supporting table is rotating. Both the robot motion and the table speed are adjusted as a function of the tool's location to provide the adequate wear pattern. The bridge (diagonal on the picture) serves for mechanical adjustments on the support system (prior to installation of the mirror). During figuring its only function is to move the spherometer across the mirror surface.
At the end of the grinding phase the mirror surface is within approximately 1 m RMS of the final shape. At this point,lateral interface pads are glued onto the outer edge of the mirror and the mirror is transferred onto the polishing machine. The latter is identical to the figuring machine and sits at the bottom of a 30-m high optical test tower.
At the early stage of polishing the mirror is controlled by infrared interferometry at 10.6 m through an infrared null-lens.Thereafter it will be tested by interferometry at 633 nm through a visible null-lens. Both compensators are of the Oeffner type.Table 1 lists the characteristics of the metrology at each step of the figuring process.
| Step | Test method | Sampling | Accuracy | PTV Sensitivity |
| (RMS Wavefront) | (Wavefront) | |||
| Grinding | Spherometry | 320 | 0.5 µm | 1 µm |
| fine grinding- rough polishing |
IR Interferometry | 30 x 30 | 250 nm | 150 nm |
| Polishing | Visible Interferometry | 250 x 250 | 20 nm | 5 nm |
4. FINAL TESTING
Inspections and quality assurance verifications occur periodically during the manufacturing processes. In the following emphasis will be put on acceptance testing.
Verification of the mirror blanks compliance is performed through a series of dimensional measurements, together with measurements of material properties, e.g. Young's modulus, average value and dispersion of the coefficient of thermal expansion, and internal characteristics, e.g. mapping of inclusions, stress birefringence at the edges and at inclusions.
Final verification of the compliance of the polished mirror assemblies is done according to the plan outlined in figure 7. The mirror is inspected for physical characteristics (weight, dimensions),for interfaces (geometry, distribution, safety with respect to overload) and optical quality. In the following emphasis will be put on the latter.
Whereby active optics allows for a reduction of manufacturing tolerances, the measurement of surface deviations after active correction shall be performed within the same accuracy as fora passive mirror. Hence the mirror surface is mapped by high sampling visible interferometry (REOSC FLIP technique) through the visible null-lens.
A number of cross-checks are required to ensure that no systematic error (e.g. matching error) has escaped detection. Potential error sources and the corresponding cross-checks are illustrated in figure 8. The general principle is to cross-check the highly accurate interferometric data in the simplest manner, priority being given to reliability. Indeed the objective is to ensure that, would an error have escaped detection, a minor active correction will ufficient to restore nominal performance. In short, highly accurate tests are complemented with highly reliable debugging tests.
The optical prescription is verified by three complementary tests:
- spherometry;
- distance measurement mirror to null-lens;
- one-dimensional direct Hartmann test.
These tests ensure that the matching error, if any, is below 200nm wavefront RMS i.e. well within the range of a minor active correction.
In addition, the components of the null-lenses are measured individually,the vertical thermal gradient in the test tower is measured before each series of interferometric tests and the support system is calibrated twice against independent, certified pressure references.
The mirror is measured at different orientations to track possible a symmetries e.g. in the alignment of the set-up. The sampling of the full aperture test is 250250 measurement points on the mirror, which limits the minimum period of detectable wavefront errors to 64 mm. Higher spatial frequencies are sampled by sub-pupi linterferometric tests providing 250250 points on circular sub-pupils of 2.5-m diameter.
 Figure 7 Figure 7 |
 Figure 8 Figure 8 |
5. RESULTS
5.1 Mirror blanks
In table 2 the characteristics of the three first mirror blanks are compared to the specifications. Not listed are the small cavities ground out from the convex surface to remove critical inclusions or cracks. The surfaces of these cavities are acid-etched to improve strength locally. Selecting the proper orientation of the blank before mounting interfaces allows to locate these defects in low stress areas; indeed in all cases investigated so far, peak stresses occur elsewhere in the blanks.
Geometrical characteristics are by far within the specifications and the homogeneity of material properties is simply outstanding.Inclusions (including bubbles) content is particularly low. Residual stresses, as predicted by modeling and measured by birefringence,are negligible.
The first three blanks meet all specifications and have been delivered within the contractual time limits and budget.
| Characteristic | Specified | Blank 1 | Blank 2 | Blank 3 | |
| Geometrical dimensions | |||||
| Outer diameter | 82002 | 8201.52 | 8201.74 | 8201.72 | mm |
| Diameter. center hole | 1000 ± 0.5 | 999.81 | 999.93 | 999.87 | mm |
| Concentricity | 1 | 0.01 | 0.01 | 0.01 | mm |
| Thickness | 177+2-0 | 177.9 | 177.7 | 177.5 | mm |
| Concave surface | |||||
| Curvature | 28975 | 28975 | 28975 | 28975 | mm |
| Profile tolerance | 2 | 0.12 | 0.08 | 0.08 | mm |
| Convex surface | |||||
| Curvature | 28977 | 28977 | 28977 | 28977 | mm |
| Profile tolerance | 2 | 0.05 | 0.07 | 0.06 | mm |
| Material properties | |||||
| Density | 2.53 | 2.534 | 2.534 | 2.534 | |
| CTE | 0+-0.15 10-6 | -0.043 10-6 | -0.032 10-6 | -0.040 10-6 | K-1 |
| Homogeneity | <0.05 10-6 | 0.009 10-6 | 0.011 10-6 | 0.024 10-6 | K-1 |
| Young's modulus | 91000 | 90000 | 90000 | 90400 | Mpa |
| Poisson's ratio | 0.24 | 0.243 | 0.243 | 0.243 | |
| Internal quality | |||||
| Inclusions in critical volume | |||||
| Mean size | < 5 | < 0.5 | < 0.5 | < 0.6 | mm |
| Max. size | < 8 | 2.3 | 3.5 | 1.1 | mm |
| Average number | < 0.5 | < 0.01 | < 0.01 | < 0.01 | cm-3 |
| Max. in 10 cm3 | 8 | < 4 | < 4 | < 4 | |
| Stress birefringence caused by inclusions | |||||
| in critical volume | 25 | 21 | <12 | 0 | nm |
| outside critical vol. | 50 | 30 | <12 | 27 | nm |
| Permanent stress at outer edge (compressive) | |||||
| Mean value | -10 | -6.2 | - 9.3 | -6.5 | nm/cm |
| Max. value | -20 | -7.0 | -10.4 | -8.3 | nm/cm |
5.2 Finished mirrors
Two mirrors have been completed and tested so far. Interferometrictests have revealed that in active mode both mirrors are diffraction-limitedat H (wavefront RMS error of 43 and 38 nm, respectively).
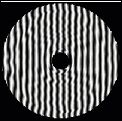
In the telescope the force accuracy of the active support systemshall be within a few grams to provide highly accurate correction.The support system for manufacturing and testing must be accurateenough to allow precise wavefront measurements i.e. interferogramacquisition and processing. Hence the required accuracy for themanufacturing and testing support system is 2 N, sufficient fortesting but not for completely removing low order terms. Thereforeraw interferograms still contain a few fringes (mostly astigmatism)and the correction must be finished off mathematically to determinethe actual quality of the mirror. Figure 9 shows a synthetic interferogramof the second mirror after active correction and mathematicalremoval of all terms which shall be corrected in the telescope.
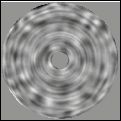
Figure 10 shows the wavefront error map of the first mirror. Bothmirrors have the characteristic zonal defects of fast aspheres(f/1.8 with a nominal conic constant -1.00469).
Care shall be taken in interpreting the data shown herein. Highspatial frequencies visible on the interferogram and wavefrontmaps correspond to periods comparable or larger than the atmosphericcoherence length (25 cm for a seeing of 0.4 arc seconds in thevisible). Indeed the surface is relatively smooth at very highspatial frequencies; sub-pupil interferometric tests with 250250points on 2.5-m diameter areas reveal that the wavefront variationfor spatial periods below ~20 cm is in the 5 nm RMS range anddecreasing at even higher spatial frequencies.
Table 3 lists the essential results obtained with the two firstmirrors. In this table the curvature and the conic constant areobtained from the direct Hartmann test. The correlation with othermeasurements such as spherometry and distance measurement mirror-to-null-lensis about 2 mm on the curvature and below measurement noise onthe asphericity. Hence there is an exceptionally good agreementbetween all tests aimed at tracking errors of matching.
REOSC made a particular effort in achieving identical curvatures,thereby simplifying the problem of matching the image scales ofeach telescope in interferometric mode. Preliminary measurementsmade after fine grinding shows that this superb result will probablybe repeated with the third mirror.
Correction forces determined from each series of interferometricmeasurement are stable within ~5 N. These variations are likelyto be due to drifts of the force settings as well as support inaccuracyand variations of thermal conditions. Vertical thermal gradientsin the test tower were found to be of the order of 2 ºK orless, and horizontal gradients below 0.1 ºK.
| Specification | Mirror 1 | Mirror 2 | ||
| Radius of curvature | 28800 ± 100 | 28762.9 | 28764.9 | mm |
| Conic constant (passive mode) | -1.004616 | -1.004457 | -1.005089 | |
| Active forces | ±120 | -83 +52 | +-80 | N |
| RMS Wavefront (active mode) | N/A | 43 | 38 | nm |
| RMS Slope (active mode) | N/A | 0.055 | 0.055 | arc secs |
| Strehl ratio at =500 nm | 0.25 | 0.714 | 0.791 | |
| CIR (=500 nm, ro=500 mm (*)) | 0.820 | 0.854 | 0.884 | |
| Microroughness | N/A | 15-20 | 8-11 | Å |
Whereby the second mirror requires higher correction forces itsintrinsic quality is higher; indeed the surface is somewhat smootherthan for the first mirror.
Microroughness has been substantially improved with the secondmirror, by changing the PH and the relative proportion of slurryand water during the last polishing runs.
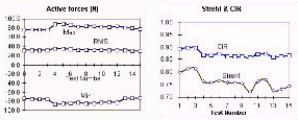
Figure 11 shows the variations of peak forces and optical qualityobserved between 16 series of measurements distributed over 4different orientations of the second mirror with respect to thetest set-up. The first 5 tests (No 0 to 4) were done with thean orientation of the mirror with respect to the test set-up identicalto the orientation of the mirror during the manufacturing tests.Tests No 5, 6, 7 were done with a 90º offset, No 8 to 13with a 180º offset and 14 to 16 with a 270º offset.The slightly higher forces and lower CIR and Strehl in activemode (figure 12) at non-zero offsets indicate that there is partialcompensation between the errors of the setup and the errors ofthe mirror at the 0º orientation, a normal consequence ofthe computer-controlled polishing process with optical tests ata "standard" orientation. The effect is fairly small,and at least partially imputable to the centering of the lensesin the Oeffner compensator. Because such errors have a well-knownsymmetry (coma of third and higher orders) they can be tracedby suitable post-processing of the wavefront data at differentmirror orientations. Indeed the tests at four different orientationsallow to remove systematic errors of symmetry 1 and 2 (all ordersof coma and astigmatism) from the data and reconstruct a morerealistic error map of the mirror.
   |
 |
 |
| Figure 9 | Figure 10 | Figure 11 |
The accuracy of the full pupil measurements is in the range of15 nm wavefront RMS for the first mirror and 13 nm RMS for thesecond one. It was found that the accuracy of the measurementswas primarily affected by persistent turbulence patterns in thetest tower, and by drifts of the support force settings duringmeasurements. Improvements were made with the second mirror tospeed up the meticulous step-by-step test procedure and to reducethe effect of turbulence by adding series of measurements.
After post-processing to remove systematic errors of symmetry1 and 2 imputable to the test set-up, the measurement accuracybecomes better than 10 nm RMS (wavefront, high spatial frequencies).
The final map of the first mirror was obtained from a total of1200 phase maps at three different orientation (mirror rotationwith respect to the test set-up); the second one was mapped from3200 phase maps taken at four different orientations. Each individualphase map represents approximately 50,000 measurement points overthe optical surface.
It shall be pointed out that the convergence of the figuring processin the last stages of polishing is excellent. Thus it seems thata substantially better quality could be achieved within a reasonableeffort. For the VLT such improvement is however not deemed necessary.Figure 12 shows the effect of the mirror high spatial frequencyerrors on simulated sky images. On the left is the expected imagea perfect 8-m telescope would deliver with a seeing of 0.4 arcseconds at =500 nm. On the right is the same image, recalculatedafter introducing the non-correctable terms of the first mirror.Both images are cut at the same level to allow side-by-side comparison.A fine analysis would reveal a minor degradation of contrast inthe right-hand image. The same simulation made in the near-UVand near-infrared leads to identical conclusions.
There is virtually no variation of the Full Width at Half Maximum.Figure 13 shows the superimposed profiles of the Point SpreadFunctions in the left and right images, normalized to their respectivepeaks.
 Figure 12 Figure 12 |
 Figure 13 Figure 13 |
6. CONCLUSIONS
Production of the VLT Primary Mirrors is proceeding accordingto schedule and requirements, and within budget. No major difficultyhas been evidenced so far, and the experience gathered with thefirst mirror allowed to streamline processes to such an extentthat the current production rate is in the range of one year,from blank to finished mirror. Most requirements are met withina substantial margin, and the convergence of the process is suchthat, if required, higher optical performance seems to be wellwithin the reach of the process.
The optical quality is fully in-line with the very best observingconditions permitted by ground-based astronomical sites. Majorprogress have been achieved not only in the area of production,but also in the area of optical testing; it shall be noted thatthe 10 nm wavefront RMS accuracy obtained with the second mirrorrepresents 1/60 of the test wavelength, on an optical path ofabout 60-m.
As far as optical figuring is concerned, there does not seem tobe an immediate limitation to the 8-m class. The limitation liesprobably in the area of handling, maintenance and transport. Accordingto the experience collected so far, and in view of the currentlyavailable "standard" transport equipment and routes,thin solid menisci up to about 8.4-m diameter seem to representa viable and effective solution for large telescope mirrors. Largerdiameters probably belong to the domain of segmented mirrors.
ACKNOWLEDGMENTS
A special thank is expressed to Mr. Hans MORIAN, Dr. Rudolf MÜLLERand Dr. Hartmut HÖNESS and their team of SCHOTT GlaswerkeMainz, for their outstanding contribution to the success of theproject.
Table of Content
- The VLT 8.2-m Unit Telescope
- VLT Environmental Specifications
- The VLT primary mirrors
- The VLT Primary Mirror Cooling System
- The Secondary Mirror, M2 Unit
- The M1 Cell and M3 Tower
- The VLT Active Optics System
- The VLT Adapter-Rotators
- VLT Cassegrain Adapter-Rotators
- VLT Nasmyth Adapter-Rotator
- Very Large Telescope Enclosure
- VLT Technical CCD System
- Coating Unit
- Sky Accessibility
- UT Performance