Sorry! This page is not yet available in your preferred language, so we're displaying the original version instead.
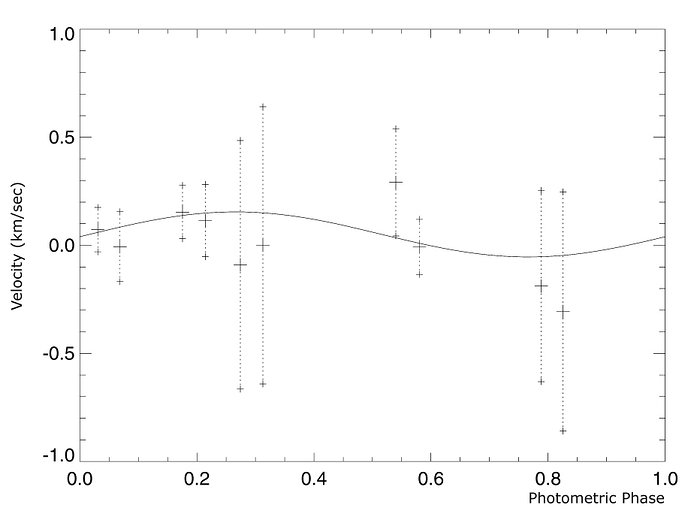
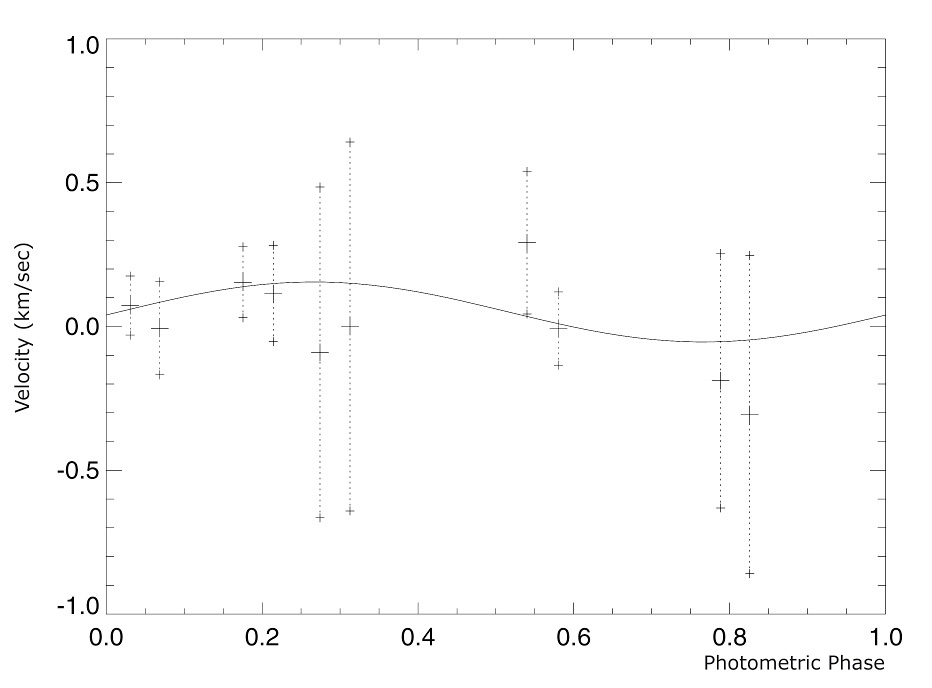
Observed velocity variation of OGLE-TR-3
This chart displays the velocity variation of the star OGLE-TR-3, as measured from ten VLT-UVES spectra (each with 1-hour exposure time) and plotted according to the "photometric phase". This means that the planetary transit occurs at phase 0 (left) and again at phase 1 (right). The observed variation is in agreement with the expected one. The fully drawn curve represents the best fit to the observations (velocity variation about 120 m/s) — the mass of the planet is derived from this.
Crédit:ESO
À propos de l'image
| Identification: | eso0311d |
| Type: | Graphique |
| Date de publication: | 22 avril 2003 |
| Communiqués de presse en rapport: | eso0311 |
| Taille: | 2750 x 2045 px |
À propos de l'objet
| Nom: | OGLE-TR-3 |
| Type: | Milky Way : Star : Circumstellar Material : Planetary System |
| Catégorie: | Exoplanets Illustrations |